Infrastructure as Code
Managing infrastructure through machine-readable definition files rather than manual configuration
Overview
Infrastructure as Code (IaC) is the practice of managing and provisioning infrastructure through code rather than manual processes. Instead of clicking through web consoles or running one-off commands, infrastructure is defined in version-controlled files that can be executed repeatedly to produce identical environments.
This approach treats infrastructure with the same rigor as application code: it’s versioned, reviewed, tested, and deployed through automated pipelines.
Why Infrastructure as Code?
The problem with manual infrastructure
Traditional infrastructure management faces several challenges:
- Inconsistency: Manual steps vary between operators and environments
- Undocumented: Critical knowledge exists only in operators’ heads
- Error-Prone: Human mistakes during repetitive tasks
- Slow: Manual provisioning takes hours or days
- Untrackable: No audit trail of what changed, when, or why
- Irreproducible: Difficulty recreating environments exactly
The IaC solution
Infrastructure as Code addresses these challenges by making infrastructure:
Declarative - Describe the desired state, not the steps to achieve it. The IaC tool handles the implementation details.
Versioned - Every infrastructure change is committed to Git, providing complete history and the ability to rollback.
Automated - Infrastructure deploys through pipelines without human intervention, eliminating manual errors.
Testable - Infrastructure changes can be validated before production deployment.
Documented - The code itself is the documentation, always current and accurate.
Reproducible - The same code produces identical infrastructure every time, across all environments.
Core Concepts
Declarative vs imperative
Imperative approaches specify the exact steps: “Create a server, then install software, then configure networking.”
Declarative approaches specify the desired outcome: “I need a server with this software and network configuration.” The IaC tool determines the necessary steps.
Most modern IaC tools use the declarative approach, making them more maintainable and resilient.
State Management
IaC tools maintain a “state” - a record of what infrastructure currently exists. When you change your code and re-run the tool, it compares the desired state (your code) with the actual state (what exists) and makes only the necessary changes.
This enables:
- Drift detection - Identify manual changes made outside IaC
- Safe updates - Modify only what changed
- Dependency management - Update resources in the correct order
Idempotency
Running the same IaC code multiple times produces the same result. If infrastructure already matches the code, the tool makes no changes. This property is called idempotency and is essential for reliable automation.
Infrastructure as Code in EDP
The Edge Developer Platform uses IaC extensively:
Terraform is our primary IaC tool for provisioning cloud resources. We use Terragrunt as an orchestration layer to manage multiple Terraform modules and reduce code duplication.
Our implementation includes:
- infra-catalogue - Reusable infrastructure components (modules, units, and stacks)
- infra-deploy - Full environment definitions using catalogue components
We organize infrastructure into stacks - coherent bundles of related components:
Each stack is defined as code, versioned independently, and can be deployed across different environments.
GitOps integration
Our IaC integrates with GitOps principles:
- All infrastructure definitions live in Git repositories
- Changes go through code review processes
- Automated pipelines deploy infrastructure
- ArgoCD continuously reconciles Kubernetes resources with Git state
This creates an auditable, automated, and reliable deployment process.
Benefits realized
Consistency across environments
Development, testing, and production environments are deployed from the same code. This eliminates the “works on my machine” problem at the infrastructure level.
Rapid environment provisioning
A complete EDP environment can be provisioned in minutes rather than days. This enables:
- Quick disaster recovery
- Easy creation of test environments
- Fast onboarding for new team members
Reduced operational risk
Code review catches infrastructure errors before deployment. Automated testing validates changes. Version control enables instant rollback if problems occur.
Knowledge sharing
Infrastructure configuration is explicit and discoverable in code. New team members can understand the platform by reading the repository rather than shadowing experienced operators.
Compliance and auditability
Every infrastructure change is tracked in Git history with author, timestamp, and reason. This provides audit trails required for compliance and simplifies troubleshooting.
Getting started
To work with EDP’s Infrastructure as Code:
- Understand Terraform basics - Review Terraform documentation
- Explore infra-catalogue - Browse infra-catalogue to understand available components
- Review existing deployments - Examine infra-deploy to see how components are composed
- Follow the Terraform guide - See Terraform-based deployment for detailed instructions
Best Practices
Based on our experience building and operating IaC:
Version everything - All infrastructure code belongs in version control. No exceptions.
Keep it simple - Start with basic modules. Add abstraction only when duplication becomes painful.
Test before production - Deploy infrastructure changes to test environments first.
Use meaningful commit messages - Explain why changes were made, not just what changed.
Review all changes - Infrastructure changes should go through the same review process as application code.
Document assumptions - Use code comments to explain non-obvious decisions.
Manage secrets securely - Never commit credentials to version control. Use secret management tools.
Plan for drift - Regularly compare actual infrastructure with code state to detect manual changes.
Challenges and limitations
Infrastructure as Code is powerful but has challenges:
Learning curve - Teams need to learn IaC tools and practices. Initial productivity may decrease.
State management complexity - State files must be stored securely and accessed by multiple team members. State corruption can cause serious issues.
Provider limitations - Not all infrastructure can be managed as code. Some resources require manual configuration.
Breaking changes - Poorly written code can destroy infrastructure. Safeguards and testing are essential.
Tool lock-in - Switching IaC tools (e.g., Terraform to Pulumi) requires rewriting infrastructure code.
Despite these challenges, the benefits far outweigh the costs for any infrastructure of meaningful complexity.
Why we invest in IaC
The IPCEI-CIS Edge Developer Platform requires reliable, reproducible infrastructure. Manual provisioning cannot meet these requirements at scale.
By investing in Infrastructure as Code:
- We can deploy complete environments consistently
- Platform engineers can focus on improvement rather than repetitive tasks
- Infrastructure changes are transparent and auditable
- New team members can contribute confidently
- Disaster recovery becomes routine rather than heroic
Our IaC tools (infra-catalogue and infra-deploy) embody these principles and enable the platform’s reliability.
Additional Resources
Infrastructure as Code Concepts
EDP-Specific Resources
1 - Terraform-based deployment of EDP
As-code definitions of EDP clusters, so they can be deployed reliably and consistently on OTC whenever needed.
Overview
The infra-deploy and infra-catalogue repositories work together to provide a framework for deploying Edge Developer Platform instances.
infra-catalogue contains individual, atomic infrastructure components: terraform modules and terragrunt units and stacks, such as Kubernetes clusters and Postgres databases.
infra-deploy then contains full definitions of stacks built using these components - such as the production site at edp.buildth.ing. It also includes scripts with which to deploy these stacks.
Note that both repositories rely on the wide range of features available on OTC. Several of these features, such as S3-compatible storage and on-demand managed Postgres instances, are not yet available on more sovereign clouds such as Edge, so these are not currently supported.
Key Features
- ‘Catalogue’ of infrastructure stacks to be used in deployments
- Definition of deployment stacks for each environment in prod or dev
- Scripts to govern deployment, installation and drift-correction of EDP
Purpose in EDP
For our Edge Developer Platform to be reliable it must be deployable in a consistent manner. When errors occur, or after any manual alterations, the system can then be safely reset to a working state. This state should be provided in code to allow for automated validation and deployment, and to allow it to be deployed from an always-identical CI/CD pipeline rather than a variable local deployment environment.
Repositories
Infra-deploy: https://edp.buildth.ing/DevFW/infra-deploy
Infra-catalogue: https://edp.buildth.ing/DevFW/infra-catalogue
Getting Started
Prerequisites
Quick Start
- Set up OTC credentials per README section
- Set cluster environment and run install script per README section
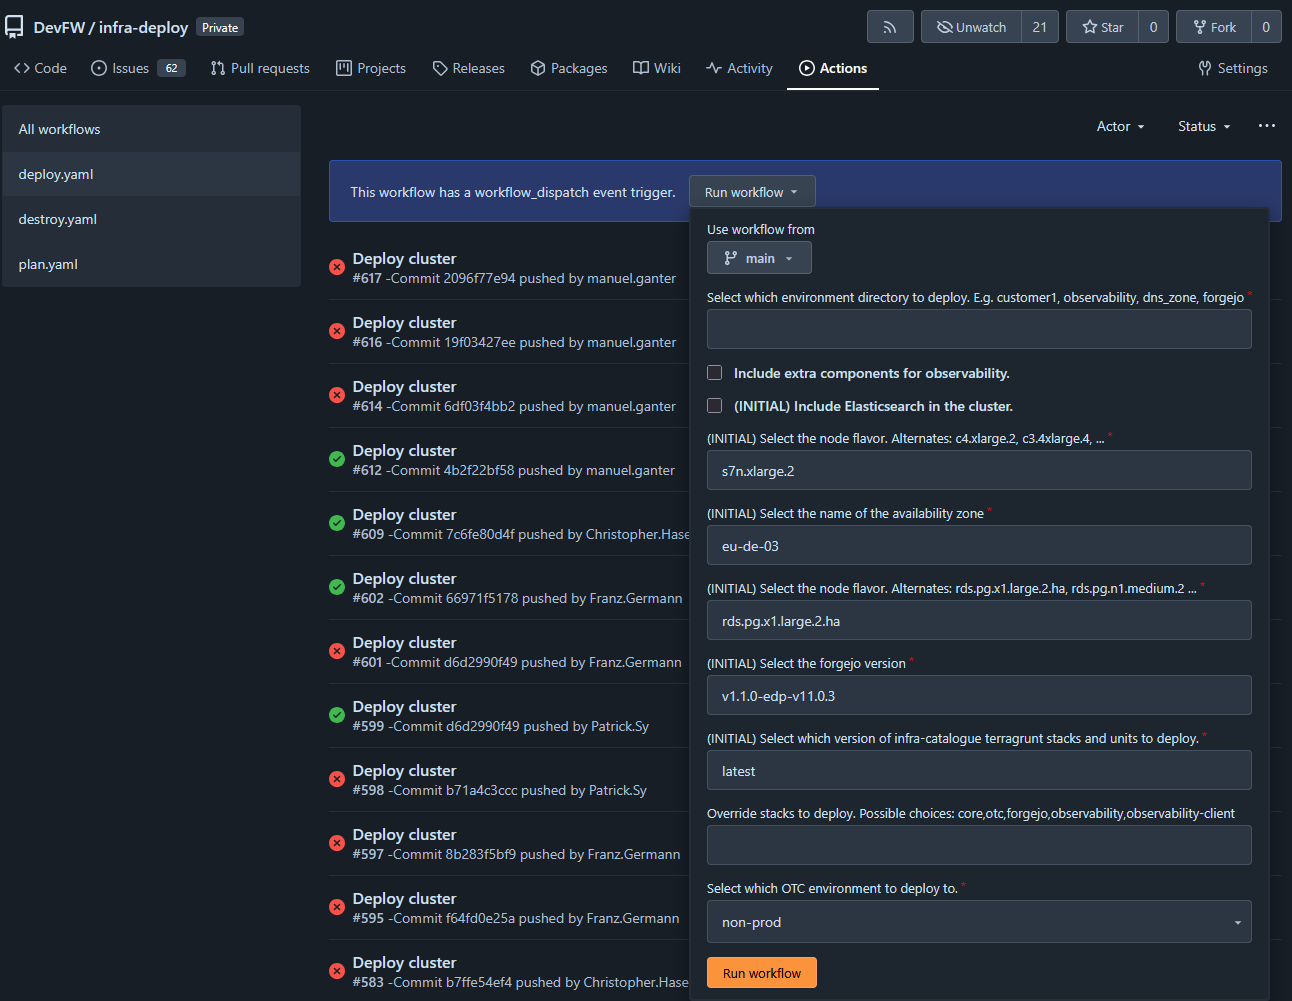
Alternatively, manually trigger automated deployment pipeline.
- You will be asked for essential information like the deployment name and tenant.
- Any fields marked
INITIAL only need to be set when first creating an environment - Thereafter, the cached values are used and the
INITIAL values provided to the pipeline are ignored.- Specifically, they are cached in a
terragrunt.values.hcl file within infra-deploy/<tenant>/<cluster-name>, where both variables are set in the pipeline - e.g. prod/edp or nonprod/garm-provider-test
Verification
After the deploymenet completes, and a short startup time, you should be able to access your Forgejo instance at <cluster-name>.buildth.ing (production tenant) or <cluster-name>.t09.de (non-prod tenant). <cluster-name> is the name you provided in the deployment pipeline, or the $CLUSTER_ENVIRONMENT variable when running manually.
For example, the primary production cluster is called edp and can be accessed at edp.buildth.ing.
Screens
Deployment using production pipeline:
 …
…

Configuration
Configuration of clusters is done in two ways. The first, mentioned above, is to provide INITIAL configuration when creating a new cluster. Thereafter, configuration is done within the relevant infra-deploy/<tenant> directory (e.g. prod/edp). Variables may be changed within the terragrunt.values.hcl file, but equally the terragrunt.stack.hcl file contains references to the lower-level code set up in infra-catalogue.
These are organised in layers, according to Terragrunt’s natural structure. First is a stack, a high-level abstraction for a whole cluster. This in turn references terragrunt units, which in turn are wrappers around standard Terraform modules.
When deployed, the Terraform modules require a provider.tf file which is automatically generated by Terragrunt using tenant-level and global configuration stored in infra-deploy.
When deploying manually (e.g. with install.sh), you can observe these layers as Terragrunt will cache them on your machine, within the .terragrunt-stack/ directory generated within /<tenant>/<cluster-name>/.
Troubleshooting
Version updates
Problem: Updates to infra-catalogue are not immediately reflected in deployed clusters, even after running deploy.
Solution: Versions must be updated.
Each cluster deployment specifies a catalogue version in its terragrunt.values.hcl; this refers to a tag in infra-catalogue. Within infra-catalogue, stacks reference units and modules from the same tag.
Thus, to test a new change to infra-catalogue, first make a new tag, then update the relevant values file to point to it.
Status
Maturity: TRL-9
Additional Resources
2 - Stacks
Platform-level component provisioning via Stacks
Overview
The stacks and stacks-instances repositories form the core of a GitOps-based system for provisioning Edge Developer Platforms (EDP). They implement a template-instance pattern that enables the deployment of reusable platform components across different environments. The concept of “stacks” originates from the CNOE.io project (Cloud Native Operational Excellence), which can be traced through the evolutionary development from edpbuilder (derived from CNOE.io’s EDPbuilder) to infra-deploy.
Key Features of the Everything-as-Code Stacks Approach
This declarative Stacks provisioning architecture is characterized by the following central properties:
Complete Code Declaration
Platform as Code: All Kubernetes resources, Helm charts, and application manifests are declaratively versioned as YAML files. The entire platform topology is traceable in Git.
Configuration as Code: Environment-specific configurations are generated through template hydration, not manually edited. Gomplate transforms generic templates into concrete configurations.
GitOps-Native Architecture
Single Source of Truth: Git is the sole source of truth for the desired state of all infrastructure and platform components.
Declarative State Management: ArgoCD continuously synchronizes the actual state with the desired state defined in Git. Deviations are automatically corrected.
Audit Trail: Every change to infrastructure or platform is documented through Git commits, with author, timestamp, and change description.
Pull-based Deployment: ArgoCD pulls changes from Git, rather than external systems requiring push access to the cluster. This significantly increases security.
Template-Instance Separation
DRY Principle (Don’t Repeat Yourself): Common platform components are defined once as templates and reused for all environments.
Environment Promotion: New environments can be quickly created through template hydration. Consistency across environments is guaranteed.
Centralized Maintainability: Updates to stack definitions can be made centrally in the stacks repository and then selectively rolled out to instances.
Customization Points: Despite reuse, environment-specific customizations remain possible through values files and manifest overlays.
Modular Composition
Stack-based Architecture: Platform capabilities are organized into independent, reusable stacks (core, otc, forgejo, observability).
Selective Deployment: Through the STACKS environment variable, only required components can be deployed selectively.
Mix-and-Match: Different stack combinations yield different platform profiles (Development, Production, Observability clusters).
Pluggable Components: New stacks can be added without modifying existing ones.
Environment Agnosticism
Cloud Provider Abstraction: Templates are formulated generically. Provider-specific details are introduced through hydration.
Multi-Cloud Ready: The architecture supports various cloud providers (currently OTC, historically KIND, extensible to AWS/Azure/GCP).
Environment Variables as Interface: All environment-specific aspects are controlled through clearly defined environment variables.
Portable Definitions: Stack definitions can be ported between environments and even cloud providers.
Self-Healing and Drift Detection
Automated Reconciliation: ArgoCD detects deviations from the desired state and corrects them automatically.
Continuous Monitoring: Permanent monitoring of cluster state compared to Git definition.
Declarative State Recovery: After failures or manual changes, the declared state is automatically restored.
Sync Policies: Configurable sync strategies (automated, manual, with pruning) per application.
Secrets Management
Secrets Outside Git: Sensitive data is not stored in Git but generated at runtime or injected from secret stores.
Generated Credentials: Passwords, tokens, and secrets are generated during deployment and directly created as Kubernetes Secrets.
Sealed Secrets Ready: The architecture is compatible with Sealed Secrets or External Secrets Operators for encrypted secret storage in Git.
Credential Rotation: Secrets can be regenerated through re-deployment.
Observability and Auditability
Declarative Monitoring: Observability stacks are part of the Platform-as-Code definition.
Deployment History: Complete history of all deployments and changes through Git log.
ArgoCD UI: Graphical representation of sync status and application topology.
Infrastructure Events: Terraform state changes and Terragrunt outputs document infrastructure changes.
Idempotence and Reproducibility
Idempotent Operations: Repeated execution of the same declaration leads to the same result without side effects.
Deterministic Builds: Same input parameters (Git commit + environment variables) produce identical environments.
Disaster Recovery: Complete environments can be rebuilt from code without restoring backups.
Testing in Production-Like Environments: Development and staging environments are code-identical to production, only with different parameter values.
Purpose in EDP
A ‘stack’ is the declarative description for the platform provisionning in an EDP installation.
Repository
Code:
Documentation: [Link to component-specific documentation]
The stacks Repository
Purpose and Structure
The stacks repository contains reusable template definitions for platform components. It serves as a central library of building blocks from which Edge Developer Platforms can be composed.
stacks/
└── template/
    ├── edfbuilder.yaml
    ├── registry/
    │   ├── core.yaml
    │   ├── otc.yaml
    │   ├── forgejo.yaml
    │   ├── observability.yaml
    │   └── observability-client.yaml
    └── stacks/
        ├── core/
        ├── otc/
        ├── forgejo/
        ├── observability/
        └── observability-client/
Components
edfbuilder.yaml: The central bootstrap definition. This is an ArgoCD Application that references the registry directory and serves as the entry point for the entire platform provisioning.
registry/: Contains ArgoCD ApplicationSets that function as a meta-layer. Each file defines a category of stacks (e.g., core, forgejo, observability) and references the corresponding subdirectory in stacks/.
stacks/: The actual platform components, organized into thematic categories:
- core: Fundamental components such as ArgoCD, CloudNative PostgreSQL, Dex (SSO)
- otc: Cloud-provider-specific components for Open Telekom Cloud (cert-manager, ingress-nginx, StorageClasses)
- forgejo: Git server and CI runners
- observability: Central observability components (Grafana, Victoria Metrics Stack)
- observability-client: Client-side metrics collection for non-observability clusters
Each stack consists of:
- YAML definitions (primarily ArgoCD Applications)
values.yaml files for Helm chartsmanifests/ directories for additional Kubernetes resources
Templating Mechanism
The templates use Gomplate with delimiter syntax {{{ }}} for environment variables:
repoURL: "https://{{{ .Env.CLIENT_REPO_DOMAIN }}}/{{{ .Env.CLIENT_REPO_ORG_NAME }}}"
path: "{{{ .Env.CLIENT_REPO_ID }}}/{{{ .Env.DOMAIN }}}/stacks/core"
These placeholders are replaced with environment-specific values during the deployment phase.
The stacks-instances Repository
Purpose and Structure
The stacks-instances repository contains the materialized, environment-specific configurations. While stacks provides the blueprints, stacks-instances contains the actual deployment definitions for concrete environments.
stacks-instances/
└── otc/
    ├── osctest.t09.de/
    │   ├── edfbuilder.yaml
    │   ├── registry/
    │   └── stacks/
    ├── backup-test-manu.t09.de/
    │   ├── edfbuilder.yaml
    │   ├── registry/
    │   └── stacks/
    └── ...
Organizational Principle
The structure follows the schema {cloud-provider}/{domain}/:
- cloud-provider: Identifies the cloud environment (e.g.,
otc for Open Telekom Cloud) - domain: The fully qualified domain name of the environment (e.g.,
osctest.t09.de)
Each environment replicates the structure of stacks/template, but with resolved template variables and environment-specific customizations.
Usage by ArgoCD
ArgoCD synchronizes directly from this repository. Applications reference paths such as:
source:
  path: "otc/osctest.t09.de/stacks/core"
  repoURL: "https://edp.buildth.ing/DevFW-CICD/stacks-instances"
  targetRevision: HEAD
This enables true GitOps: every change to the configurations is traceable through Git commits and automatically synchronized by ArgoCD in the target environment.
The infra-deploy Repository
Role in the Overall Architecture
The infra-deploy repository is the orchestration layer that coordinates both infrastructure and platform provisioning. It represents the evolution of edpbuilder, which was originally derived from the CNOE.io project’s EDPbuilder.
Two-Phase Provisioning
Phase 1: Infrastructure Provisioning
Uses Terragrunt Stacks (experimental feature) to provision cloud resources:
infra-deploy/
├── root.hcl
├── non-prod/
│   ├── tenant.hcl
│   ├── dns_zone/
│   │   ├── terragrunt.hcl
│   │   ├── terragrunt.stack.hcl
│   │   └── terragrunt.values.hcl
│   └── testing/
├── prod/
└── templates/
    └── forgejo/
        ├── terragrunt.hcl
        └── terragrunt.stack.hcl
Terragrunt Stacks provision:
- VPC and network segments
- Kubernetes clusters (CCE on OTC)
- Managed databases (RDS PostgreSQL)
- Load balancers and DNS entries
- Security groups and other cloud resources
Phase 2: Platform Provisioning
The script scripts/edp-install.sh executes the following steps:
Template Hydration:
- Checkout of the
stacks repository - Execution of Gomplate to resolve template variables
- Generation of environment-specific manifests
Instance Management:
- Checkout/update of the
stacks-instances repository - During CI execution: commit and push of the new instance
Secrets Management:
- Generation of credentials (database passwords, SSO secrets, API tokens)
- Creation of Kubernetes Secrets
Bootstrap:
- Helm-based installation of ArgoCD
- Application of
edfbuilder.yaml or selective registry entries
GitOps Handover:
- ArgoCD takes over further synchronization from
stacks-instances - Continuous monitoring and self-healing
GitHub Actions Workflows
The .github/workflows/ directory contains three central workflows:
deploy.yaml: Complete deployment pipeline with the following inputs:
- Cluster environment and tenant (prod/non-prod)
- Node flavor and availability zone
- Stack selection (core, otc, forgejo, observability, etc.)
- Infra-catalogue version
plan.yaml: Terraform/Terragrunt plan preview without execution
destroy.yaml: Controlled teardown of environments
Deployment Workflow
The complete provisioning process proceeds as follows:
Initiation: GitHub Actions workflow is triggered (manually or automatically)
Environment Preparation:
export CLUSTER_ENVIRONMENT=qa-stage
cd scripts
./new-otc-env.sh  # Creates Terragrunt configuration if new
Infrastructure Provisioning:
./ensure-cluster.sh otc
# Internally executes:
# - ./ensure-otc-cluster.sh
# - terragrunt stack run apply
Platform Provisioning:
./edp-install.sh
# Executes:
# - Checkout of stacks
# - Gomplate hydration
# - Checkout/update of stacks-instances
# - Secrets generation
# - ArgoCD installation
# - Bootstrap of stacks
ArgoCD Synchronization: ArgoCD continuously reads from stacks-instances and synchronizes the desired state
The CNOE.io Stacks Concept
The term “stacks” originates from the Cloud Native Operational Excellence (CNOE.io) project. The core idea is the composition of platform capabilities from modular, reusable building blocks.
Principles
Modularity: Each stack is a self-contained unit with clear dependencies
Composability: Stacks can be freely combined to create different platform profiles
Declarativeness: All configurations are declarative and GitOps-capable
Environment-agnostic: Templates are generic; environment specifics are introduced through hydration
Stack Selection and Combinations
The environment variable STACKS controls which components are deployed:
# Complete EDP with central observability
STACKS="core,otc,forgejo,observability"

# Application cluster with client-side observability
STACKS="core,otc,forgejo,observability-client"

# Minimal development environment
STACKS="core,forgejo"
Data Flow and Dependencies
┌─────────────────┐
│  GitHub Actions │
│  (deploy.yaml)  │
└────────┬────────┘
         │
         ├─> Phase 1: Infrastructure
         │   ┌──────────────────┐
         │   │  infra-deploy    │
         │   │  (Terragrunt)    │
         │   └────────┬─────────┘
         │            │
         │            v
         │   ┌──────────────────┐
         │   │  Cloud Provider  │
         │   │  (OTC)           │
         │   │  - VPC           │
         │   │  - K8s Cluster   │
         │   │  - RDS           │
         │   └──────────────────┘
         │
         └─> Phase 2: Platform
             ┌──────────────────┐
             │  edp-install.sh  │
             └────────┬─────────┘
                      │
                      ├─> Checkout: stacks (Templates)
                      │   └─> Gomplate Hydration
                      │
                      ├─> Checkout/Update: stacks-instances
                      │
                      ├─> Secrets Generation
                      │
                      ├─> ArgoCD Installation (Helm)
                      │
                      └─> Bootstrap (edfbuilder.yaml)
                          │
                          v
                 ┌────────────────┐
                 │    ArgoCD      │
                 └────────┬───────┘
                          │
                          └─> Continuous Synchronization
                              from stacks-instances
                              │
                              v
                       ┌──────────────┐
                       │  Kubernetes  │
                       │  Cluster     │
                       └──────────────┘
Historical Context: edpbuilder to infra-deploy
The evolution from edpbuilder to infra-deploy demonstrates the maturation of the architecture:
edpbuilder (Origin):
- Directly derived from CNOE.io’s
EDPbuilder - Focus on local KIND clusters
- Manual configuration
- Monolithic structure
infra-deploy (Current):
- Production-ready for cloud deployments (OTC)
- Terragrunt-based infrastructure orchestration
- CI/CD integration via GitHub Actions
- Clear separation between infrastructure and platform
- Template-instance separation through stacks/stacks-instances
Technical Particularities
Gomplate Templating
Gomplate is used with custom delimiters {{{ }}} to avoid conflicts with Helm templating ({{ }}):
gomplate --input-dir="stacks/template" \
         --output-dir="work" \
         --left-delim "{{{" \
         --right-delim "}}}"
Terragrunt Experimental Stacks
The use of Terragrunt Stacks requires the experimental flag:
export TG_EXPERIMENT_MODE=true
terragrunt stack run apply
This enables hierarchical organization of Terraform modules with dependency management.
ArgoCD ApplicationSets
The registry pattern uses ArgoCD Applications that reference directories:
source:
  path: "otc/osctest.t09.de/stacks/core"
ArgoCD automatically detects all YAML files in the path and synchronizes them as Applications.
Best Practices and Patterns
Immutable Infrastructure: Every environment is fully defined in Git
Secrets Outside Git: Sensitive data is generated at runtime or injected from secret stores
Progressive Rollouts: New environments start as template instances, then are individually customized
Version Pinning: Critical components (Helm charts, Terragrunt modules) are pinned to specific versions
Namespace Isolation: Each stack deploys into dedicated namespaces
Self-Healing: ArgoCD’s automated sync policy enables automatic drift correction
Usage Examples
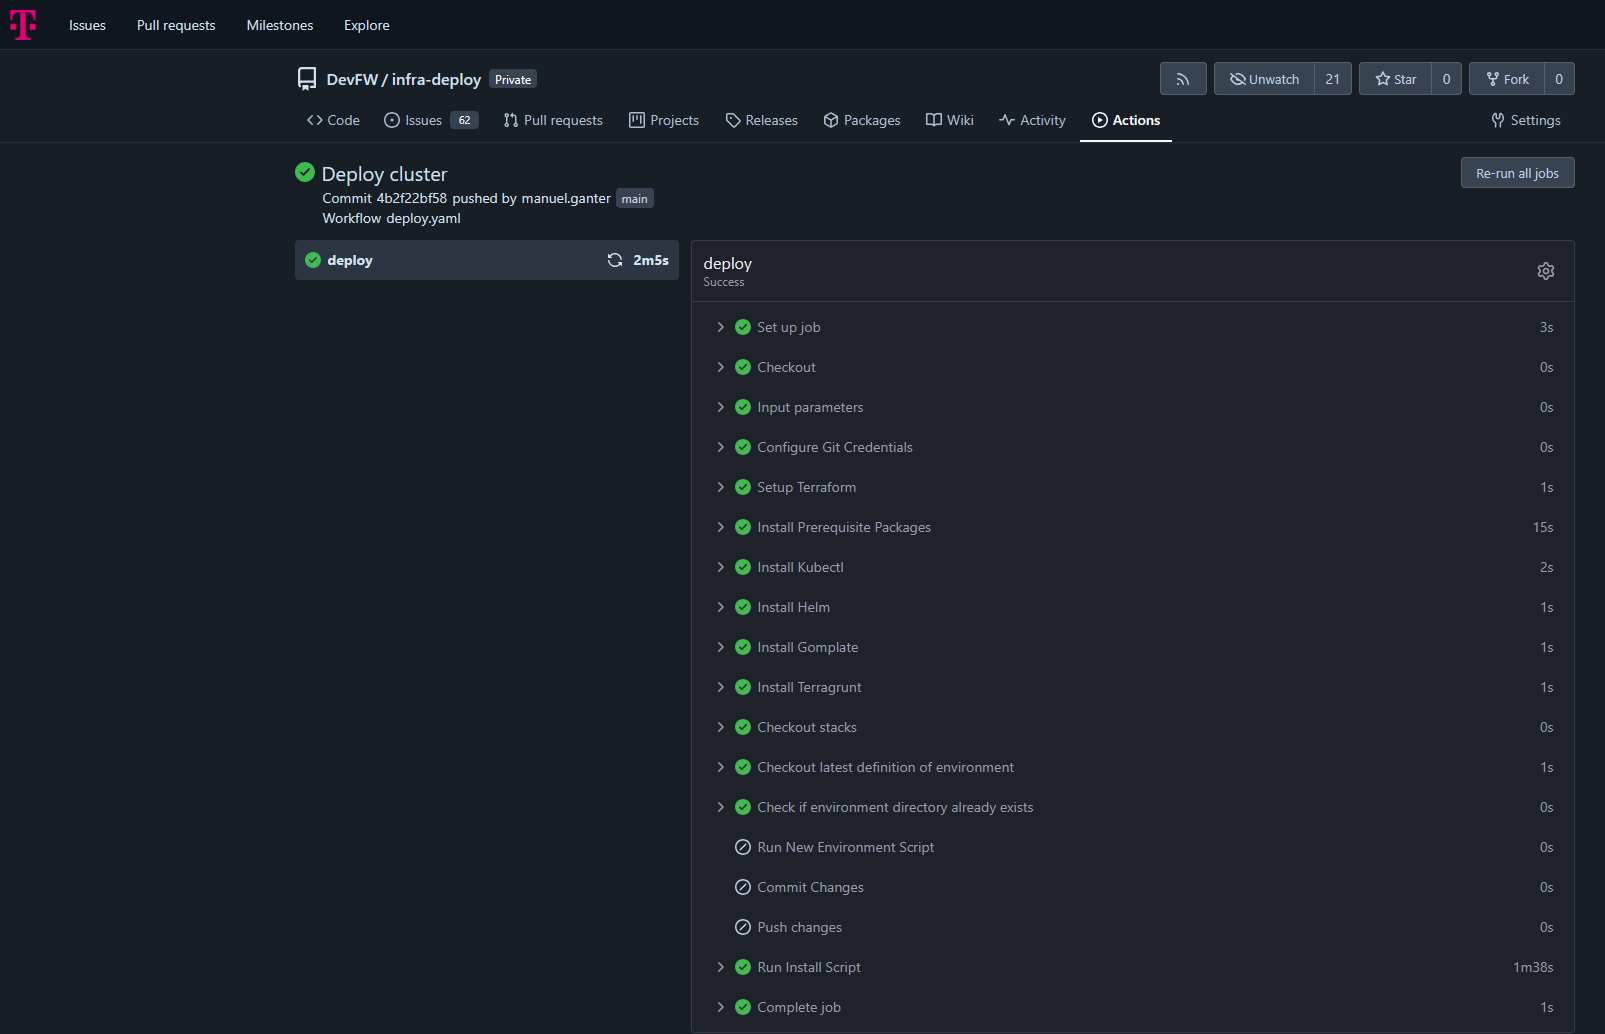
Deployment by Pipeline
The platform deployment is the second part of the EDP installtaion. First there is the infrastructure setup, which ends with a created kubernetes cluster. Then the platform provisioning by the defined stacks is done. Both is runnable by the deploypipelien in infra-deploy:
The green pipeline looks liek this:
Local setup with ‘kind’
It’s also possible to just run the second part, the stcks provisionning. Then you need to have a kubernetes cluster already running, which is e.g. feasable by a local kind-cluster.
So imagine, you want to to the stacks ‘core,observability’ on your local machine. Then you can run the local entzr
# have kind insatlled
# in /infra-deploy

# provide a kind cluster
kind delete clusters --all
./scripts/ensure-kind-cluster.sh -r

# provide some emnv vars
export TERRAFORM=/bin/bash
export LOADBALANCER_ID=ABC
export DOMAIN=ABC
export DOMAIN_GITEA=ABC
export OS_ACCESS_KEY=ABC
export OS_SECRET_KEY=ABC
export STACKS=core,observability

# deploy
./scripts/edp-install.sh
Status
Maturity: [Production]
Additional Resources
2.1 - Core
Essential infrastructure components for GitOps, database management, and single sign-on
Overview
The Core stack provides foundational infrastructure components required by all other Edge Developer Platform stacks. It establishes the base layer for continuous deployment, database services, and centralized authentication, enabling a secure, scalable platform architecture.
The Core stack deploys ArgoCD for GitOps orchestration, CloudNativePG for PostgreSQL database management, and Dex for OpenID Connect single sign-on capabilities.
Key Features
- GitOps Continuous Deployment: ArgoCD manages declarative infrastructure and application deployments
- Database Operator: CloudNativePG provides enterprise-grade PostgreSQL clusters for platform services
- Single Sign-On: Dex offers centralized OIDC authentication across platform components
- Automated Synchronization: Self-healing deployments with automatic drift correction
- Role-Based Access Control: Integrated RBAC for secure platform administration
- TLS Certificate Management: Automated certificate provisioning and renewal
Repository
Code: Core Stack Templates
Documentation:
Getting Started
Prerequisites
- Kubernetes cluster (1.24+)
- kubectl configured with cluster access
- Ingress controller (nginx recommended)
- cert-manager for TLS certificate management
- Domain names configured for platform services
Quick Start
The Core stack is deployed as the foundation of the EDP installation:
Trigger Deploy Pipeline
- Go to Infra Deploy Pipeline
- Click on Run workflow
- Enter a name in “Select environment directory to deploy”. This must be DNS Compatible. (if you enter
test-me then domains will be argocd.test-me.t09.de, dex.test-me.t09.de) - Execute workflow
ArgoCD Bootstrap
The deployment automatically provisions:
- ArgoCD control plane in
argocd namespace - CloudNativePG operator in
cloudnative-pg namespace - Dex identity provider in
dex namespace - Ingress configurations with TLS certificates
- OIDC authentication integration
Verification
Verify the Core stack deployment:
# Check ArgoCD installation
kubectl get application -n argocd
kubectl get pods -n argocd

# Verify CloudNativePG operator
kubectl get pods -n cloudnative-pg
kubectl get crd | grep cnpg.io

# Check Dex deployment
kubectl get pods -n dex
kubectl get ingress -n dex

# Verify ingress configurations
kubectl get ingress -n argocd
Access ArgoCD at https://argocd.{DOMAIN} and authenticate via Dex SSO. Or use username admin and the secret inside of kubernetes argocd/argocd-initial-admin-secret as password kubectl get secret -n argocd argocd-initial-admin-secret -ojson | jq -r .data.password | base64 -d.
Architecture
Component Architecture
The Core stack establishes a three-tier foundation:
ArgoCD Control Plane:
- Application management and GitOps reconciliation
- Multi-repository tracking with automated sync
- Resource health monitoring and drift detection
- Integrated RBAC with SSO authentication
CloudNativePG Operator:
- PostgreSQL cluster lifecycle management
- Automated backup and recovery
- High availability and failover
- Storage provisioning via CSI drivers
Dex Identity Provider:
- OpenID Connect authentication service
- Multiple connector support (Forgejo/Gitea, LDAP, SAML)
- Static client registration for platform services
- Token issuance and validation
Networking
Ingress Architecture:
- nginx ingress controller for external access
- TLS termination with cert-manager integration
- Domain-based routing for platform services
Kubernetes Services:
- Internal service communication via ClusterIP
- DNS-based service discovery
- Network policies for security segmentation
Configuration
ArgoCD Configuration
Deployed via Helm chart v9.1.5 with custom values in stacks/core/argocd/values.yaml:
OIDC Authentication:
configs:
  cm:
    url: "https://{DOMAIN_ARGOCD}"
    oidc.config: |
      name: Forgejo
      issuer: https://{DOMAIN_DEX}
      clientID: controller-argocd-dex
      clientSecret: $dex-controller-argocd-dex:dex-controller-argocd-dex
      requestedScopes: ["openid", "profile", "email", "groups"]
RBAC Policy:
policy.csv: |
  g, DevFW, role:admin
Server Settings:
- Insecure mode enabled (TLS handled by ingress)
- Annotation-based resource tracking
- 60-second reconciliation timeout
- Resource exclusions for ProviderConfigUsage and CiliumIdentity
CloudNativePG Configuration
Deployed via Helm chart v0.26.1 with values in stacks/core/cloudnative-pg/values.yaml:
Operator Settings:
- Namespace:
cloudnative-pg - Automated database cluster provisioning
- Custom resource definitions for Cluster, Database, and Pooler resources
Storage Configuration:
- Uses
csi-disk storage class by default - PVC provisioning for PostgreSQL data
- Backup storage integration (S3-compatible)
Dex Configuration
Deployed via Helm chart v0.23.0 with values in stacks/core/dex/values.yaml:
Issuer Configuration:
config:
  issuer: https://{DOMAIN_DEX}
  storage:
    type: memory  # Use persistent storage for production
  oauth2:
    skipApprovalScreen: true
    alwaysShowLoginScreen: false
Forgejo Connector:
connectors:
  - type: gitea
    id: forgejo
    name: Forgejo
    config:
      clientID: $FORGEJO_CLIENT_ID
      clientSecret: $FORGEJO_CLIENT_SECRET
      redirectURI: https://{DOMAIN_DEX}/callback
      baseURL: https://edp.buildth.ing
      orgs:
        - name: DevFW
Static OAuth2 Clients:
- ArgoCD:
controller-argocd-dex - Grafana:
controller-grafana-dex
Environment Variables
Core stack services use the following environment variables:
Domain Configuration:
DOMAIN_ARGOCD: ArgoCD web interface URLDOMAIN_DEX: Dex authentication service URLDOMAIN_GITEA: Forgejo/Gitea repository URLDOMAIN_GRAFANA: Grafana observability dashboard URL
Repository Configuration:
CLIENT_REPO_ID: Repository identifier for stack configurationsCLIENT_REPO_DOMAIN: Git repository domainCLIENT_REPO_ORG_NAME: Organization name for stack instances
Usage Examples
Managing Applications with ArgoCD
Access and manage applications through ArgoCD:
# Login to ArgoCD CLI
argocd login argocd.${DOMAIN} --sso

# List all applications
argocd app list

# Get application status
argocd app get coder

# Sync application manually
argocd app sync coder

# View application logs
argocd app logs coder

# Diff application state
argocd app diff coder
Creating a PostgreSQL Database
Deploy a PostgreSQL cluster using CloudNativePG:
# database-cluster.yaml
apiVersion: postgresql.cnpg.io/v1
kind: Cluster
metadata:
  name: app-db
  namespace: my-app
spec:
  instances: 3
  storage:
    size: 20Gi
    storageClass: csi-disk
  postgresql:
    parameters:
      max_connections: "100"
      shared_buffers: "256MB"
  bootstrap:
    initdb:
      database: appdb
      owner: appuser
Apply the configuration:
kubectl apply -f database-cluster.yaml

# Check cluster status
kubectl get cluster app-db -n my-app
kubectl get pods -n my-app -l cnpg.io/cluster=app-db

# Get connection credentials
kubectl get secret app-db-app -n my-app -o jsonpath='{.data.password}' | base64 -d
Configuring SSO for Applications
Add OAuth2 applications to Dex for SSO integration:
# Add to dex values.yaml
staticClients:
  - id: my-app-client
    redirectURIs:
      - 'https://myapp.{DOMAIN}/callback'
    name: 'My Application'
    secretEnv: MY_APP_CLIENT_SECRET
Configure the application to use Dex:
# Application OIDC configuration
OIDC_ISSUER=https://dex.${DOMAIN}
OIDC_CLIENT_ID=my-app-client
OIDC_CLIENT_SECRET=${MY_APP_CLIENT_SECRET}
OIDC_REDIRECT_URI=https://myapp.${DOMAIN}/callback
Deploying Applications via ArgoCD
Create an ArgoCD Application manifest:
# my-app.yaml
apiVersion: argoproj.io/v1alpha1
kind: Application
metadata:
  name: my-app
  namespace: argocd
spec:
  project: default
  source:
    repoURL: 'https://github.com/myorg/my-app'
    targetRevision: main
    path: k8s
  destination:
    server: 'https://kubernetes.default.svc'
    namespace: my-app
  syncPolicy:
    automated:
      prune: true
      selfHeal: true
    syncOptions:
      - CreateNamespace=true
Push it to stacks instances to be picked up by argo
Integration Points
- All Stacks: Core stack is a prerequisite for all other EDP stacks
- OTC Stack: Provides ingress-nginx and cert-manager dependencies
- Coder Stack: Uses CloudNativePG for workspace database management
- Forgejo Stack: Integrates with Dex for SSO and ArgoCD for deployment
- Observability Stack: Uses Dex for Grafana authentication and ArgoCD for deployment
- Provider Stack: Deploys Terraform providers via ArgoCD
Troubleshooting
ArgoCD Not Accessible
Problem: Cannot access ArgoCD web interface
Solution:
Verify ingress configuration:
kubectl get ingress -n argocd
kubectl describe ingress -n argocd
Check ArgoCD server status:
kubectl get pods -n argocd
kubectl logs -n argocd -l app.kubernetes.io/name=argocd-server
Verify TLS certificate:
kubectl get certificate -n argocd
kubectl describe certificate -n argocd
Test DNS resolution:
nslookup argocd.${DOMAIN}
Dex Authentication Failing
Problem: SSO login fails or redirects incorrectly
Solution:
Check Dex logs:
kubectl logs -n dex -l app.kubernetes.io/name=dex
Verify Forgejo connector configuration:
kubectl get secret -n dex
kubectl get configmap -n dex dex -o yaml
Test Dex issuer endpoint:
curl https://dex.${DOMAIN}/.well-known/openid-configuration
Verify OAuth2 client credentials match in both Dex and consuming application
CloudNativePG Operator Not Running
Problem: PostgreSQL clusters fail to provision
Solution:
Check operator status:
kubectl get pods -n cloudnative-pg
kubectl logs -n cloudnative-pg -l app.kubernetes.io/name=cloudnative-pg
Verify CRDs are installed:
kubectl get crd | grep cnpg.io
kubectl describe crd clusters.postgresql.cnpg.io
Check operator logs for errors:
kubectl logs -n cloudnative-pg -l app.kubernetes.io/name=cloudnative-pg --tail=100
Application Sync Failures
Problem: ArgoCD applications remain out of sync or fail to deploy
Solution:
Check application status:
argocd app get <app-name>
kubectl describe application <app-name> -n argocd
Review sync operation logs:
argocd app logs <app-name>
Verify repository access:
argocd repo list
argocd repo get <repo-url>
Check for resource conflicts or missing dependencies:
kubectl get events -n <app-namespace> --sort-by='.lastTimestamp'
Database Connection Issues
Problem: Applications cannot connect to CloudNativePG databases
Solution:
Verify cluster is ready:
kubectl get cluster <cluster-name> -n <namespace>
kubectl describe cluster <cluster-name> -n <namespace>
Check database credentials secret:
kubectl get secret <cluster-name>-app -n <namespace>
kubectl get secret <cluster-name>-app -n <namespace> -o yaml
Test connection from a pod:
kubectl run -it --rm psql-test --image=postgres:16 --restart=Never -- \
  psql "$(kubectl get secret <cluster-name>-app -n <namespace> -o jsonpath='{.data.uri}' | base64 -d)"
Review PostgreSQL logs:
kubectl logs -n <namespace> <cluster-name>-1
Additional Resources
2.2 - OTC
Open Telekom Cloud infrastructure components for ingress, TLS, and storage
Overview
The OTC (Open Telekom Cloud) stack provides essential infrastructure components for deploying applications on Open Telekom Cloud environments. It configures ingress routing, automated TLS certificate management, and cloud-native storage provisioning tailored specifically for OTC’s Kubernetes infrastructure.
This stack serves as a foundational layer that other platform stacks depend on for external access, secure communication, and persistent storage.
Key Features
- Automated TLS Certificate Management: Let’s Encrypt integration via cert-manager for automatic certificate provisioning and renewal
- Cloud Load Balancer Integration: Nginx ingress controller configured with OTC-specific Elastic Load Balancer (ELB) annotations
- Native Storage Provisioning: Default StorageClass using Huawei FlexVolume provisioner for block storage
- Prometheus Metrics: Built-in monitoring capabilities for ingress traffic and performance
- High Availability: Rolling update strategy with minimal downtime
- HTTP-01 Challenge Support: ACME validation through ingress for certificate issuance
Repository
Code: OTC Stack Templates
Documentation:
Getting Started
Prerequisites
- Kubernetes cluster running on Open Telekom Cloud
- ArgoCD installed (provided by
core stack) - Environment variables configured:
LOADBALANCER_ID: OTC Elastic Load Balancer IDLOADBALANCER_IP: OTC Elastic Load Balancer IP addressCLIENT_REPO_DOMAIN: Git repository domainCLIENT_REPO_ORG_NAME: Git repository organizationCLIENT_REPO_ID: Client repository identifierDOMAIN: Domain name for the environment
Quick Start
The OTC stack is deployed as part of the EDP installation process:
Trigger Deploy Pipeline
- Go to Infra Deploy Pipeline
- Click on Run workflow
- Enter a name in “Select environment directory to deploy”. This must be DNS Compatible.
- Execute workflow
ArgoCD Synchronization
ArgoCD automatically deploys:
- cert-manager with ClusterIssuer for Let’s Encrypt
- ingress-nginx controller with OTC load balancer integration
- Default StorageClass for OTC block storage
Verification
Verify the OTC stack deployment:
# Check ArgoCD applications status
kubectl get application otc -n argocd
kubectl get application cert-manager -n argocd
kubectl get application ingress-nginx -n argocd
kubectl get application storageclass -n argocd

# Verify cert-manager pods
kubectl get pods -n cert-manager

# Check ingress-nginx controller
kubectl get pods -n ingress-nginx

# Verify ClusterIssuer status
kubectl get clusterissuer main

# Check StorageClass
kubectl get storageclass default
Architecture
Component Architecture
The OTC stack consists of three primary components:
cert-manager:
- Automates TLS certificate lifecycle management
- Integrates with Let’s Encrypt ACME server (production endpoint)
- Uses HTTP-01 challenge validation via ingress
- Creates and manages certificates as Kubernetes resources
- Single replica deployment
ingress-nginx:
- Kubernetes ingress controller based on Nginx
- Routes external traffic to internal services
- Integrated with OTC Elastic Load Balancer (ELB)
- Supports TLS termination with cert-manager issued certificates
- Rolling update strategy with max 1 unavailable pod
- Prometheus metrics exporter with ServiceMonitor
StorageClass:
- Default storage provisioner for persistent volumes
- Uses Huawei FlexVolume driver (
flexvolume-huawei.com/fuxivol) - SATA block storage type
- Immediate volume binding mode
- Supports dynamic volume expansion
Integration Flow
External Traffic → OTC ELB → ingress-nginx → Kubernetes Services
                                    ↓
                              cert-manager (TLS certificates)
                                    ↓
                              Let's Encrypt ACME
Configuration
cert-manager Configuration
Helm Values (stacks/otc/cert-manager/values.yaml):
crds:
  enabled: true
replicaCount: 1
ClusterIssuer (stacks/otc/cert-manager/manifests/clusterissuer.yaml):
apiVersion: cert-manager.io/v1
kind: ClusterIssuer
metadata:
  name: main
spec:
  acme:
    email: admin@think-ahead.tech
    server: https://acme-v02.api.letsencrypt.org/directory
    privateKeySecretRef:
      name: cluster-issuer-account-key
    solvers:
    - http01:
        ingress:
          ingressClassName: nginx
Key Settings:
- CRDs installed automatically
- Production Let’s Encrypt ACME endpoint
- HTTP-01 validation through nginx ingress
- ClusterIssuer named
main for cluster-wide certificate issuance
ingress-nginx Configuration
Helm Values (stacks/otc/ingress-nginx/values.yaml):
controller:
  updateStrategy:
    type: RollingUpdate
    rollingUpdate:
      maxUnavailable: 1
  service:
    annotations:
      kubernetes.io/elb.class: union
      kubernetes.io/elb.port: '80'
      kubernetes.io/elb.id: {{{ .Env.LOADBALANCER_ID }}}
      kubernetes.io/elb.ip: {{{ .Env.LOADBALANCER_IP }}}
  ingressClassResource:
    name: nginx
  allowSnippetAnnotations: true
  config:
    proxy-buffer-size: 32k
    use-forwarded-headers: "true"
  metrics:
    enabled: true
    serviceMonitor:
      additionalLabels:
        release: "ingress-nginx"
      enabled: true
Key Settings:
- OTC Load Balancer Integration: Annotations configure connection to OTC ELB
- Rolling Updates: Minimizes downtime with 1 pod unavailable during updates
- Snippet Annotations: Enabled for advanced ingress configuration (idpbuilder compatibility)
- Proxy Buffer: 32k buffer size for handling large headers
- Forwarded Headers: Preserves original client information through proxies
- Metrics: Prometheus ServiceMonitor for observability
StorageClass Configuration
StorageClass (stacks/otc/storageclass/storageclass.yaml):
apiVersion: storage.k8s.io/v1
kind: StorageClass
metadata:
  annotations:
    storageclass.beta.kubernetes.io/is-default-class: "true"
  name: default
parameters:
  kubernetes.io/hw:passthrough: "true"
  kubernetes.io/storagetype: BS
  kubernetes.io/volumetype: SATA
  kubernetes.io/zone: eu-de-02
provisioner: flexvolume-huawei.com/fuxivol
reclaimPolicy: Delete
volumeBindingMode: Immediate
allowVolumeExpansion: true
Key Settings:
- Default StorageClass: Automatically used when no StorageClass specified
- OTC Zone: Provisioned in
eu-de-02 availability zone - SATA Volumes: Block storage (BS) with SATA performance tier
- Volume Expansion: Supports resizing persistent volumes dynamically
- Reclaim Policy: Volumes deleted when PersistentVolumeClaim is removed
ArgoCD Application Configuration
Registry Application (template/registry/otc.yaml):
- Name:
otc - Manages the OTC stack directory
- Automated sync with prune and self-heal enabled
- Creates namespaces automatically
Component Applications:
cert-manager (referenced in stack):
- Deploys cert-manager Helm chart
- Automated self-healing enabled
- Includes ClusterIssuer manifest for Let’s Encrypt
ingress-nginx (template/stacks/otc/ingress-nginx.yaml):
- Deploys from official Kubernetes ingress-nginx repository
- Chart version: helm-chart-4.12.1
- References environment-specific values from stacks-instances repository
storageclass (template/stacks/otc/storageclass.yaml):
- Deploys StorageClass manifest
- Managed as ArgoCD Application
- Automated sync with unlimited retries
Usage Examples
Creating an Ingress with Automatic TLS
Create an ingress resource that automatically provisions a TLS certificate:
apiVersion: networking.k8s.io/v1
kind: Ingress
metadata:
  name: my-app
  namespace: my-namespace
  annotations:
    cert-manager.io/cluster-issuer: main
    nginx.ingress.kubernetes.io/ssl-redirect: "true"
spec:
  ingressClassName: nginx
  tls:
  - hosts:
    - myapp.example.com
    secretName: myapp-tls
  rules:
  - host: myapp.example.com
    http:
      paths:
      - path: /
        pathType: Prefix
        backend:
          service:
            name: my-app-service
            port:
              number: 80
cert-manager will automatically:
- Detect the ingress with
cert-manager.io/cluster-issuer annotation - Create a Certificate resource
- Request certificate from Let’s Encrypt using HTTP-01 challenge
- Store certificate in
myapp-tls secret - Renew certificate before expiration
Creating a PersistentVolumeClaim
Use the default OTC StorageClass for persistent storage:
apiVersion: v1
kind: PersistentVolumeClaim
metadata:
  name: my-data
  namespace: my-namespace
spec:
  accessModes:
  - ReadWriteOnce
  resources:
    requests:
      storage: 10Gi
  storageClassName: csi-disk
Expanding an Existing Volume
Resize a persistent volume by editing the PVC:
# Edit the PVC storage request
kubectl patch pvc my-data -n my-namespace -p '{"spec":{"resources":{"requests":{"storage":"20Gi"}}}}'

# Verify expansion
kubectl get pvc my-data -n my-namespace
The volume will expand automatically due to allowVolumeExpansion: true in the StorageClass.
Custom Ingress Configuration
Use nginx ingress snippets for advanced routing:
apiVersion: networking.k8s.io/v1
kind: Ingress
metadata:
  name: advanced-app
  annotations:
    cert-manager.io/cluster-issuer: main
    nginx.ingress.kubernetes.io/configuration-snippet: |
      more_set_headers "X-Custom-Header: value";
      if ($http_user_agent ~* "bot") {
        return 403;
      }
spec:
  ingressClassName: nginx
  rules:
  - host: app.example.com
    http:
      paths:
      - path: /
        pathType: Prefix
        backend:
          service:
            name: app-service
            port:
              number: 8080
Integration Points
- Core Stack: Requires ArgoCD for deployment orchestration
- All Application Stacks: Depends on OTC stack for:
- External access via ingress-nginx
- TLS certificates via cert-manager
- Persistent storage via default StorageClass
- Observability Stack: ingress-nginx metrics exported to Prometheus
- Coder Stack: Uses ingress and cert-manager for workspace access
- Forgejo Stack: Requires ingress and TLS for Git repository access
Troubleshooting
Certificate Issuance Fails
Problem: Certificate remains in Pending state and is not issued
Solution:
Check Certificate status:
kubectl get certificate -A
kubectl describe certificate <cert-name> -n <namespace>
Verify ClusterIssuer is ready:
kubectl get clusterissuer main
kubectl describe clusterissuer main
Check cert-manager logs:
kubectl logs -n cert-manager -l app=cert-manager
Verify HTTP-01 challenge can reach ingress:
kubectl get challenges -A
kubectl describe challenge <challenge-name> -n <namespace>
Common issues:
- DNS not pointing to load balancer IP
- Firewall blocking HTTP (port 80) traffic
- Ingress class not set to
nginx - Let’s Encrypt rate limits exceeded
Ingress Controller Not Ready
Problem: ingress-nginx pods are not running or LoadBalancer service has no external IP
Solution:
Check ingress controller status:
kubectl get pods -n ingress-nginx
kubectl logs -n ingress-nginx -l app.kubernetes.io/component=controller
Verify LoadBalancer service:
kubectl get svc -n ingress-nginx
kubectl describe svc ingress-nginx-controller -n ingress-nginx
Check OTC load balancer annotations:
kubectl get svc ingress-nginx-controller -n ingress-nginx -o yaml
Verify environment variables are set correctly:
LOADBALANCER_ID matches OTC ELB IDLOADBALANCER_IP matches ELB public IP
Check OTC console for ELB configuration and health checks
Storage Provisioning Fails
Problem: PersistentVolumeClaim remains in Pending state
Solution:
Check PVC status:
kubectl get pvc -A
kubectl describe pvc <pvc-name> -n <namespace>
Verify StorageClass exists and is default:
kubectl get storageclass
kubectl describe storageclass default
Check volume provisioner logs:
kubectl logs -n kube-system -l app=csi-disk-plugin
Common issues:
- Insufficient quota in OTC project
- Invalid zone configuration (must be
eu-de-02) - Requested storage size exceeds limits
- Missing IAM permissions for volume creation
Ingress Returns 503 Service Unavailable
Problem: Ingress configured but returns 503 error
Solution:
Verify backend service exists:
kubectl get svc <service-name> -n <namespace>
kubectl get endpoints <service-name> -n <namespace>
Check if pods are ready:
kubectl get pods -n <namespace> -l <service-selector>
Verify ingress configuration:
kubectl describe ingress <ingress-name> -n <namespace>
Check nginx ingress logs:
kubectl logs -n ingress-nginx -l app.kubernetes.io/component=controller --tail=100
Test service connectivity from ingress controller:
kubectl exec -n ingress-nginx <controller-pod> -- curl http://<service-name>.<namespace>.svc.cluster.local:<port>
TLS Certificate Shows as Invalid
Problem: Browser shows certificate warning or certificate details are incorrect
Solution:
Verify certificate is ready:
kubectl get certificate <cert-name> -n <namespace>
Check certificate contents:
kubectl get secret <tls-secret-name> -n <namespace> -o jsonpath='{.data.tls\.crt}' | base64 -d | openssl x509 -text -noout
Ensure certificate covers the correct domain:
kubectl describe certificate <cert-name> -n <namespace>
Force certificate renewal if expired or incorrect:
kubectl delete certificate <cert-name> -n <namespace>
# cert-manager will automatically recreate it
Additional Resources
2.3 - Coder
Cloud Development Environments for secure, scalable remote development
Overview
Coder is an enterprise cloud development environment (CDE) platform that provisions secure, consistent remote development workspaces. As part of the Edge Developer Platform, Coder enables developers to work in standardized, on-demand environments defined as code, moving development workloads from local machines to centrally managed infrastructure.
The Coder stack deploys a self-hosted Coder instance with PostgreSQL database backend, integrated authentication, and edge connectivity capabilities.
Key Features
- Infrastructure as Code Workspaces: Development environments defined using Terraform templates
- IDE Agnostic: Supports browser-based IDEs, VS Code, JetBrains IDEs, and other development tools
- Secure Remote Access: Workspaces run in controlled cloud or on-premises infrastructure
- On-Demand Provisioning: Developers create ephemeral or persistent workspaces as needed
- AI Agent Support: Secure execution environment for AI coding assistants
- Template-Based Deployment: Reusable workspace templates ensure consistency across teams
Repository
Code: Coder Stack Templates
Documentation:
Getting Started
Prerequisites
- Kubernetes cluster with ArgoCD installed (provided by
core stack) - CloudNativePG operator (provided by
core stack) - Ingress controller configured (provided by
otc stack) - cert-manager for TLS certificate management (provided by
otc stack) - Domain name configured via
DOMAIN_GITEA environment variable
Quick Start
The Coder stack is deployed as part of the EDP installation process:
- Trigger Deploy Pipeline
- Go to Infra Deploy Pipeline
- Click on Run workflow
- Enter a name in “Select environment directory to deploy”. This must be DNS Compatible. (if you enter
test-me then the domain will be coder.test-me.t09.de) - Execute workflow
- ArgoCD Synchronization
ArgoCD automatically deploys:
- PostgreSQL database cluster (CloudNativePG)
- Coder application (Helm chart v2.28.3)
- Ingress configuration with TLS
- Database credentials and edge connectivity secrets
Verification
Verify the Coder deployment:
# Check ArgoCD application status
kubectl get application coder -n argocd

# Verify Coder pods are running
kubectl get pods -n coder

# Check PostgreSQL cluster status
kubectl get cluster coder-db -n coder

# Verify ingress configuration
kubectl get ingress -n coder
Access the Coder web interface at https://coder.{DOMAIN_GITEA}.
Architecture
Component Architecture
The Coder stack consists of:
Coder Control Plane:
- Web application for workspace management
- API server for workspace provisioning
- Terraform executor for infrastructure operations
PostgreSQL Database:
- Single-instance CloudNativePG cluster
- Stores workspace metadata, templates, and user data
- Managed database user with
coder-db-user secret - 10Gi persistent storage on
csi-disk storage class
Networking:
- ClusterIP service for internal communication
- Nginx ingress with TLS termination
- cert-manager integration for automatic certificate management
Configuration
Environment Variables
The Coder application is configured through environment variables in values.yaml:
Access Configuration:
CODER_ACCESS_URL: Public URL where Coder is accessible (https://coder.{DOMAIN_GITEA})
Database Configuration:
CODER_PG_CONNECTION_URL: PostgreSQL connection string (from coder-db-user secret)
Authentication:
CODER_OAUTH2_GITHUB_DEFAULT_PROVIDER_ENABLE: GitHub OAuth integration (disabled by default)
Edge Connectivity:
EDGE_CONNECT_ENDPOINT: Edge connection endpoint (from edge-credential secret)EDGE_CONNECT_USERNAME: Edge authentication usernameEDGE_CONNECT_PASSWORD: Edge authentication password
Helm Chart Configuration
Key Helm values configured in stacks/coder/coder/values.yaml:
coder:
  env:
    - name: CODER_ACCESS_URL
      value: "https://coder.{DOMAIN_GITEA}"
    - name: CODER_PG_CONNECTION_URL
      valueFrom:
        secretKeyRef:
          name: coder-db-user
          key: uri

  service:
    type: ClusterIP

  ingress:
    enable: true
    className: nginx
    host: "coder.{DOMAIN_GITEA}"
    annotations:
      cert-manager.io/cluster-issuer: main
    tls:
      enable: true
      secretName: coder-tls-secret
Important: Do not override CODER_HTTP_ADDRESS, CODER_TLS_ENABLE, CODER_TLS_CERT_FILE, or CODER_TLS_KEY_FILE as these are managed by the Helm chart.
PostgreSQL Database Configuration
Defined in stacks/coder/coder/manifests/postgres.yaml:
Cluster Specification:
- 1 instance (single-node cluster)
- Primary update strategy: unsupervised
- Resource requests/limits: 1 CPU, 1Gi memory
- Storage: 10Gi using
csi-disk storage class
Managed Roles:
- User:
coder - Permissions: createdb, login
- Password stored in
coder-db-user secret
ArgoCD Application Configuration
Registry Application (template/registry/coder.yaml):
- Name:
coder-reg - Manages the Coder stack directory
- Automated sync with prune and self-heal enabled
Stack Application (template/stacks/coder/coder.yaml):
- Name:
coder - Deploys Coder Helm chart v2.28.3 from
https://helm.coder.com/v2 - Automated self-healing enabled
- Creates namespace automatically
- References values from
stacks-instances repository
Usage Examples
Creating a Workspace Template
After deployment, create workspace templates using Terraform:
Access Coder Dashboard
open https://coder.${DOMAIN_GITEA}
Create Template Repository
Create a Git repository with a Terraform template:
# main.tf
terraform {
  required_providers {
    coder = {
      source  = "coder/coder"
      version = "~> 0.12"
    }
    kubernetes = {
      source  = "hashicorp/kubernetes"
      version = "~> 2.23"
    }
  }
}

resource "coder_agent" "main" {
  os   = "linux"
  arch = "amd64"
}

resource "kubernetes_pod" "main" {
  metadata {
    name      = "coder-${data.coder_workspace.me.owner}-${data.coder_workspace.me.name}"
    namespace = "coder-workspaces"
  }
  spec {
    container {
      name  = "dev"
      image = "codercom/enterprise-base:ubuntu"
      command = ["sh", "-c", coder_agent.main.init_script]
    }
  }
}
Push Template to Coder
coder templates push kubernetes-dev
Provisioning a Development Workspace
# Create a new workspace from template
coder create my-workspace --template kubernetes-dev

# Connect via SSH
coder ssh my-workspace

# Open in VS Code
coder open my-workspace --ide vscode

# Stop workspace when not in use
coder stop my-workspace

# Delete workspace
coder delete my-workspace
Access EDP platform services from Coder workspaces:
# Connect to platform PostgreSQL
psql "postgresql://myuser@postgres.core.svc.cluster.local:5432/mydb"

# Access Forgejo
git clone https://forgejo.${DOMAIN_GITEA}/myorg/myrepo.git

# Query platform metrics
curl https://grafana.${DOMAIN}/api/datasources
Integration Points
- Core Stack: Depends on ArgoCD for deployment orchestration and CloudNativePG operator for database management
- OTC Stack: Requires ingress-nginx controller and cert-manager for external access and TLS
- Forgejo Stack: Workspace templates can integrate with platform Git repositories
- Observability Stack: Workspace metrics can be collected by platform observability tools
- Dex (SSO): Can be configured for centralized authentication (requires additional configuration)
Troubleshooting
Coder Pods Not Starting
Problem: Coder pods remain in Pending or CrashLoopBackOff state
Solution:
Check PostgreSQL cluster status:
kubectl get cluster coder-db -n coder
kubectl describe cluster coder-db -n coder
Verify database credentials secret:
kubectl get secret coder-db-user -n coder
kubectl get secret coder-db-user -n coder -o jsonpath='{.data.uri}' | base64 -d
Check Coder logs:
kubectl logs -n coder -l app=coder
Cannot Access Coder UI
Problem: Coder web interface is not accessible at configured URL
Solution:
Verify ingress configuration:
kubectl get ingress -n coder
kubectl describe ingress -n coder
Check TLS certificate status:
kubectl get certificate -n coder
kubectl describe certificate coder-tls-secret -n coder
Verify DNS resolution:
nslookup coder.${DOMAIN_GITEA}
Database Connection Errors
Problem: Coder cannot connect to PostgreSQL database
Solution:
Verify PostgreSQL cluster health:
kubectl get pods -n coder -l cnpg.io/cluster=coder-db
kubectl logs -n coder -l cnpg.io/cluster=coder-db
Check database and user creation:
kubectl get database coder -n coder
kubectl exec -it coder-db-1 -n coder -- psql -U postgres -c "\l"
kubectl exec -it coder-db-1 -n coder -- psql -U postgres -c "\du"
Test connection string:
kubectl exec -it coder-db-1 -n coder -- psql "$(kubectl get secret coder-db-user -n coder -o jsonpath='{.data.uri}' | base64 -d)"
Workspace Provisioning Fails
Problem: Workspaces fail to provision from templates
Solution:
Check Coder provisioner logs:
kubectl logs -n coder -l app=coder --tail=100
Verify Kubernetes permissions for workspace creation:
kubectl auth can-i create pods --as=system:serviceaccount:coder:coder -n coder-workspaces
Review template Terraform configuration for errors
Additional Resources
2.4 - Terralist
Private Terraform Module and Provider Registry with OAuth authentication
Overview
Terralist is an open-source private Terraform registry for modules and providers that implements the HashiCorp registry protocol. As part of the Edge Developer Platform, Terralist enables teams to securely store, version, and distribute internal Terraform modules and providers with built-in authentication and documentation capabilities.
The Terralist stack deploys a self-hosted instance with OAuth2 authentication, persistent storage, and integrated ingress for secure access.
Key Features
- Private Module Registry: Securely host and distribute confidential Terraform modules and providers
- HashiCorp Protocol Compatible: Works seamlessly with
terraform CLI and standard registry workflows - OAuth2 Authentication: Integrated OIDC authentication supporting
terraform login command - Documentation Interface: Web UI to visualize artifacts with automatic module documentation
- Flexible Storage: Supports local storage or remote cloud buckets with presigned URLs
- Git Integration: Works with mono-repositories while leveraging Terraform version attributes
- API Management: RESTful API for programmatic module and provider management
Repository
Code: Terralist Stack Templates
Documentation:
Getting Started
Prerequisites
- Kubernetes cluster with ArgoCD installed (provided by
core stack) - Ingress controller configured (provided by
otc stack) - cert-manager for TLS certificate management (provided by
otc stack) - Domain name configured via
DOMAIN_GITEA environment variable - OAuth2 provider configured (Dex or external provider)
Quick Start
The Terralist stack is deployed as part of the EDP installation process:
Trigger Deploy Pipeline
- Go to Infra Deploy Pipeline
- Click on Run workflow
- Enter a name in “Select environment directory to deploy”. This must be DNS Compatible. (if you enter
test-me then the domain will be terralist.test-me.t09.de) - Execute workflow
ArgoCD Synchronization
ArgoCD automatically deploys:
- Terralist application (Helm chart v0.8.1)
- Persistent volume for module storage
- Ingress configuration with TLS
- OAuth2 credentials and configuration
Verification
Verify the Terralist deployment:
# Check ArgoCD application status
kubectl get application terralist -n argocd

# Verify Terralist pods are running
kubectl get pods -n terralist

# Check persistent volume claim
kubectl get pvc -n terralist

# Verify ingress configuration
kubectl get ingress -n terralist
Access the Terralist web interface at https://terralist.{DOMAIN_GITEA}.
Architecture
Component Architecture
The Terralist stack consists of:
Terralist Application:
- Web interface for module and provider management
- REST API for programmatic access
- OAuth2 authentication handler
- Module documentation renderer
Storage Layer:
- SQLite database for metadata and configuration
- Local filesystem storage for modules and providers
- Persistent volume with 10Gi capacity on
csi-disk storage class - Optional cloud bucket integration for remote storage
Networking:
- Nginx ingress with TLS termination
- cert-manager integration for automatic certificate management
- OAuth2 callback endpoint configuration
Configuration
Environment Variables
The Terralist application is configured through environment variables in values.yaml:
OAuth2 Configuration:
TERRALIST_AUTHORITY_URL: OIDC provider authority URL (from terralist-oidc-secrets secret)TERRALIST_CLIENT_ID: OAuth2 client identifierTERRALIST_CLIENT_SECRET: OAuth2 client secretTERRALIST_TOKEN_SIGNING_SECRET: Secret for token signing and validation
Storage Configuration:
- SQLite database at
/data/database.db - Module storage at
/data/modules
Helm Chart Configuration
Key Helm values configured in stacks/terralist/terralist/values.yaml:
controllers:
  main:
    strategy: Recreate
    containers:
      main:
        env:
          - name: TERRALIST_AUTHORITY_URL
            valueFrom:
              secretKeyRef:
                name: terralist-oidc-secrets
                key: authority_url
          - name: TERRALIST_CLIENT_ID
            valueFrom:
              secretKeyRef:
                name: terralist-oidc-secrets
                key: client_id

ingress:
  main:
    enabled: true
    className: nginx
    hosts:
      - host: "terralist.{DOMAIN_GITEA}"
        paths:
          - path: /
            service:
              identifier: main
    annotations:
      cert-manager.io/cluster-issuer: main
    tls:
      - secretName: terralist-tls-secret
        hosts:
          - "terralist.{DOMAIN_GITEA}"

persistence:
  data:
    enabled: true
    size: 10Gi
    storageClass: csi-disk
    accessMode: ReadWriteOnce
ArgoCD Application Configuration
Registry Application (template/registry/terralist.yaml):
- Name:
terralist-reg - Manages the Terralist stack directory
- Automated sync with prune and self-heal enabled
Stack Application (template/stacks/terralist/terralist.yaml):
- Name:
terralist - Deploys Terralist Helm chart v0.8.1 from
https://github.com/terralist/helm-charts - Automated self-healing enabled
- Creates namespace automatically
- References values from
stacks-instances repository
Usage Examples
Authenticating with Terralist
Configure Terraform CLI to use your private registry:
# Authenticate using OAuth2
terraform login terralist.${DOMAIN_GITEA}

# This opens a browser window for OAuth2 authentication
# After successful login, credentials are stored in ~/.terraform.d/credentials.tfrc.json
Publishing a Module
Publish a module to your private registry:
Create Module Structure
my-module/
├── main.tf
├── variables.tf
├── outputs.tf
└── README.md
Tag and Push via API
# Package module
tar -czf my-module-1.0.0.tar.gz my-module/

# Upload to Terralist (requires authentication token)
curl -X POST https://terralist.${DOMAIN_GITEA}/v1/modules/my-org/my-module/my-provider/1.0.0 \
  -H "Authorization: Bearer ${TERRALIST_TOKEN}" \
  -F "file=@my-module-1.0.0.tar.gz"
Consuming Private Modules
Use modules from your private registry in Terraform configurations:
# Configure Terraform to use private registry
terraform {
  required_providers {
    aws = {
      source  = "hashicorp/aws"
      version = "~> 5.0"
    }
  }
}

# Reference module from private registry
module "vpc" {
  source  = "terralist.${DOMAIN_GITEA}/my-org/vpc/aws"
  version = "1.0.0"

  cidr_block = "10.0.0.0/16"
  environment = "production"
}
Browsing Module Documentation
Access the Terralist web interface to view module documentation:
# Open Terralist UI
open https://terralist.${DOMAIN_GITEA}

# Browse available modules
# - View module versions
# - Read generated documentation
# - Access module sources
# - Copy usage examples
Managing Modules via API
# List all modules
curl -H "Authorization: Bearer ${TERRALIST_TOKEN}" \
  https://terralist.${DOMAIN_GITEA}/v1/modules

# Get specific module versions
curl -H "Authorization: Bearer ${TERRALIST_TOKEN}" \
  https://terralist.${DOMAIN_GITEA}/v1/modules/my-org/my-module/my-provider

# Delete a module version
curl -X DELETE -H "Authorization: Bearer ${TERRALIST_TOKEN}" \
  https://terralist.${DOMAIN_GITEA}/v1/modules/my-org/my-module/my-provider/1.0.0
Integration Points
- Core Stack: Depends on ArgoCD for deployment orchestration
- OTC Stack: Requires ingress-nginx controller and cert-manager for external access and TLS
- Dex (SSO): Integrates with platform OAuth2 provider for authentication
- Forgejo Stack: Modules can be sourced from platform Git repositories
- Observability Stack: Application metrics can be collected by platform monitoring tools
Troubleshooting
Terralist Pod Not Starting
Problem: Terralist pod remains in Pending or CrashLoopBackOff state
Solution:
Check persistent volume claim status:
kubectl get pvc -n terralist
kubectl describe pvc data-terralist-0 -n terralist
Verify OAuth2 credentials secret:
kubectl get secret terralist-oidc-secrets -n terralist
kubectl describe secret terralist-oidc-secrets -n terralist
Check Terralist logs:
kubectl logs -n terralist -l app.kubernetes.io/name=terralist
Cannot Access Terralist UI
Problem: Terralist web interface is not accessible at configured URL
Solution:
Verify ingress configuration:
kubectl get ingress -n terralist
kubectl describe ingress -n terralist
Check TLS certificate status:
kubectl get certificate -n terralist
kubectl describe certificate terralist-tls-secret -n terralist
Verify DNS resolution:
nslookup terralist.${DOMAIN_GITEA}
OAuth2 Authentication Fails
Problem: terraform login or web authentication fails
Solution:
Verify OAuth2 configuration in secret:
kubectl get secret terralist-oidc-secrets -n terralist -o yaml
Check OAuth2 provider (Dex) is accessible:
curl https://dex.${DOMAIN_GITEA}/.well-known/openid-configuration
Verify callback URL is correctly configured in OAuth2 provider:
Expected callback: https://terralist.${DOMAIN_GITEA}/auth/cli/callback
Check Terralist logs for authentication errors:
kubectl logs -n terralist -l app.kubernetes.io/name=terralist | grep -i auth
Module Upload Fails
Problem: Cannot upload modules via API or UI
Solution:
Verify authentication token is valid:
# Test token with API call
curl -H "Authorization: Bearer ${TERRALIST_TOKEN}" \
  https://terralist.${DOMAIN_GITEA}/v1/modules
Check persistent volume has available space:
kubectl exec -n terralist -it terralist-0 -- df -h /data
Verify module package format is correct:
# Module should be a gzipped tar archive
tar -tzf my-module-1.0.0.tar.gz
Review upload logs:
kubectl logs -n terralist -l app.kubernetes.io/name=terralist --tail=50
Problem: terraform init fails to download modules from private registry
Solution:
Verify authentication credentials exist:
cat ~/.terraform.d/credentials.tfrc.json
Re-authenticate if needed:
terraform logout terralist.${DOMAIN_GITEA}
terraform login terralist.${DOMAIN_GITEA}
Test module availability via API:
curl -H "Authorization: Bearer ${TERRALIST_TOKEN}" \
  https://terralist.${DOMAIN_GITEA}/v1/modules/my-org/my-module/my-provider
Check module source URL format in Terraform configuration:
# Correct format
source = "terralist.${DOMAIN_GITEA}/org/module/provider"

# Not: https://terralist.${DOMAIN_GITEA}/...
Additional Resources
2.5 - Forgejo
Self-hosted Git service with built-in CI/CD capabilities
Overview
Forgejo is a self-hosted Git service that provides repository hosting, code collaboration, and integrated CI/CD workflows. As part of the Edge Developer Platform, Forgejo serves as the central code repository and continuous integration system, offering a complete DevOps platform with Git hosting, issue tracking, and automated build pipelines.
The Forgejo stack deploys a Forgejo server instance with PostgreSQL database backend, MinIO object storage, and Forgejo Runners for executing CI/CD workflows.
Key Features
- Git Repository Hosting: Full-featured Git server with web interface for code management
- Built-in CI/CD: Forgejo Actions provide GitHub Actions-compatible workflow automation
- Issue Tracking: Integrated project management with issues, milestones, and pull requests
- Container Registry: Built-in Docker registry for container image storage
- Code Review: Pull request workflows with inline comments and approval processes
- Scalable Runners: Distributed runner architecture with Docker-in-Docker execution
- S3 Object Storage: MinIO integration for artifacts, LFS objects, and backups
Repository
Code: Forgejo Stack Templates
Documentation:
Getting Started
Prerequisites
- Kubernetes cluster with ArgoCD installed (provided by
core stack) - CloudNativePG operator (provided by
core stack) - Ingress controller configured (provided by
otc stack) - cert-manager for TLS certificate management (provided by
otc stack) - Infrastructure deployed through Infra Deploy
Quick Start
The Forgejo stack is deployed as part of the EDP installation process:
Trigger Deploy Pipeline
- Go to Infra Deploy Pipeline
- Click on Run workflow
- Enter a name in “Select environment directory to deploy”. This must be DNS Compatible. (if you enter
test-me then the domain will be forgejo.test-me.t09.de) - Execute workflow
ArgoCD Synchronization
ArgoCD automatically deploys:
- Forgejo server (Helm chart v16.2.0)
- PostgreSQL database cluster (CloudNativePG)
- Forgejo Runners with Docker-in-Docker execution
- Ingress configuration with TLS
- Database credentials and storage secrets
Verification
Verify the Forgejo deployment:
# Check ArgoCD applications status
kubectl get application forgejo-server -n argocd
kubectl get application forgejo-runner -n argocd

# Verify Forgejo server pods are running
kubectl get pods -n gitea

# Check PostgreSQL cluster status
kubectl get cluster -n gitea

# Verify Forgejo runners are active
kubectl get pods -n gitea -l app=forgejo-runner

# Verify ingress configuration
kubectl get ingress -n gitea
Access the Forgejo web interface at https://{DOMAIN_GITEA}.
Architecture
Component Architecture
The Forgejo stack consists of:
Forgejo Server:
- Web application for Git repository management
- API server for Git operations and CI/CD orchestration
- Issue tracker and project management interface
- Container registry for Docker images
- Artifact storage via MinIO object storage
Forgejo Runners:
- 3-replica runner deployment for parallel job execution
- Docker-in-Docker (DinD) architecture for containerized builds
- Runner image:
code.forgejo.org/forgejo/runner:12.6.4 - Build container:
docker:28.0.4-dind - Supports GitHub Actions-compatible workflows
Storage Architecture:
- 200Gi persistent volume for Git repositories (GPSSD storage)
- OTC S3 object storage for LFS objects and artifacts
- Encrypted volumes using KMS key integration
- S3-compatible backup storage (100GB)
Networking:
- SSH LoadBalancer service on port 32222 for Git operations
- HTTPS ingress with TLS termination for web interface
- Internal service communication via ClusterIP
Configuration
Forgejo Server Configuration
The Forgejo server is configured through Helm values in stacks/forgejo/forgejo-server/values.yaml:
Application Settings:
FORGEJO_IMAGE_TAG: Forgejo container image version- Application name: “EDP”
- Slogan: “Build your thing in minutes”
- User registration: Disabled by default
- Email notifications: Enabled
Storage Configuration:
persistence:
  size: 200Gi
  storageClass: csi-disk
  annotations:
    everest.io/crypt-key-id: "{KMS_KEY_ID}"
    everest.io/disk-volume-type: GPSSD
Database Configuration:
Database credentials are sourced from Kubernetes secrets:
POSTGRES_HOST: PostgreSQL hostnamePOSTGRES_DB: Database namePOSTGRES_USER: Database usernamePOSTGRES_PASSWORD: Database password- SSL verification enabled
Object Storage:
- Endpoint:
obs.eu-de.otc.t-systems.com - Credentials from
gitea/forgejo-cloud-credentials secret - Used for artifacts, LFS objects, and backups
External Services:
- Redis for caching and session management
- Elasticsearch for issue indexing
- SMTP for email notifications
SSH Configuration:
service:
  ssh:
    type: LoadBalancer
    port: 32222
Forgejo Runner Configuration
Defined in stacks/forgejo/forgejo-runner/dind-docker.yaml:
Deployment Specification:
- 3 replicas for parallel execution
- Runner version: 6.4.0
- Docker DinD version: 28.0.4
Runner Registration:
- Offline registration using secret token
- Instance URL from configuration
- Predefined labels for Ubuntu 22.04 and latest
Container Configuration:
runner:
  image: code.forgejo.org/forgejo/runner:12.6.4
  privileged: true
  securityContext:
    runAsUser: 0
    allowPrivilegeEscalation: true

dind:
  image: docker:28.0.4-dind
  privileged: true
  tlsCertDir: /certs
Volume Management:
- Docker certificates volume for TLS communication
- Runner data volume for registration and configuration
- Shared socket for container communication
ArgoCD Application Configuration
Server Application (template/stacks/forgejo/forgejo-server.yaml):
- Name:
forgejo-server - Namespace:
gitea - Helm chart v12.0.0 from
https://code.forgejo.org/forgejo-helm/forgejo-helm.git - Automated self-healing enabled
- Values from
stacks-instances repository
Runner Application (template/stacks/forgejo/forgejo-runner.yaml):
- Name:
forgejo-runner - Namespace:
argocd - Deployment manifests from
stacks-instances repository - Automated sync with unlimited retries
Usage Examples
Creating Your First Repository
After deployment, create and use Git repositories:
Access Forgejo Interface
open https://${DOMAIN_GITEA}
Create a New Repository
- Click “+” icon in top right
- Select “New Repository”
- Enter repository name and description
- Choose visibility (public/private)
- Initialize with README if desired
Clone and Push Code
# Clone the repository
git clone https://${DOMAIN_GITEA}/myorg/myrepo.git
cd myrepo

# Add your code
echo "# My Project" > README.md
git add README.md
git commit -m "Initial commit"

# Push to Forgejo
git push origin main
Setting Up CI/CD with Forgejo Actions
Create automated workflows using Forgejo Actions:
Create Workflow File
mkdir -p .forgejo/workflows
cat > .forgejo/workflows/build.yaml << 'EOF'
name: Build and Test

on:
  push:
    branches: [main]
  pull_request:
    branches: [main]

jobs:
  build:
    runs-on: ubuntu-22.04
    steps:
      - name: Checkout code
        uses: actions/checkout@v4

      - name: Set up Go
        uses: actions/setup-go@v4
        with:
          go-version: '1.21'

      - name: Build
        run: go build -v ./...

      - name: Test
        run: go test -v ./...
EOF
Commit and Push Workflow
git add .forgejo/workflows/build.yaml
git commit -m "Add CI/CD workflow"
git push origin main
Monitor Workflow Execution
- Navigate to repository in Forgejo web interface
- Click “Actions” tab
- View workflow runs and logs
Building and Publishing Container Images
Use Forgejo to build and store Docker images:
# .forgejo/workflows/docker.yaml
name: Build Container Image

on:
  push:
    tags: ['v*']

jobs:
  build:
    runs-on: ubuntu-22.04
    steps:
      - name: Checkout
        uses: actions/checkout@v4

      - name: Build image
        run: |
          docker build -t forgejo.${DOMAIN_GITEA}/myorg/myapp:${GITHUB_REF_NAME} .

      - name: Login to registry
        run: |
          echo "${{ secrets.REGISTRY_PASSWORD }}" | \
          docker login forgejo.${DOMAIN_GITEA} -u "${{ secrets.REGISTRY_USER }}" --password-stdin

      - name: Push image
        run: |
          docker push forgejo.${DOMAIN_GITEA}/myorg/myapp:${GITHUB_REF_NAME}
Using SSH for Git Operations
Configure SSH access for Git operations:
# Generate SSH key if needed
ssh-keygen -t ed25519 -C "your_email@example.com"

# Add public key to Forgejo
# Navigate to: Settings -> SSH / GPG Keys -> Add Key

# Configure SSH host
cat >> ~/.ssh/config << EOF
Host forgejo.${DOMAIN_GITEA}
  Port 32222
  User git
EOF

# Clone repository via SSH
git clone ssh://git@forgejo.${DOMAIN_GITEA}:32222/myorg/myrepo.git
Integration Points
- Core Stack: Depends on ArgoCD for deployment orchestration and CloudNativePG operator for database management
- OTC Stack: Requires ingress-nginx controller and cert-manager for external access and TLS
- Coder Stack: Development workspaces can clone repositories and trigger CI/CD workflows
- Observability Stack: Prometheus metrics collection enabled via ServiceMonitor
- Dex (SSO): Can be configured for centralized authentication integration
Troubleshooting
Forgejo Server Not Starting
Problem: Forgejo server pods remain in Pending or CrashLoopBackOff state
Solution:
Check PostgreSQL cluster status:
kubectl get cluster -n gitea
kubectl describe cluster -n gitea
Verify database credentials:
kubectl get secret -n gitea | grep postgres
Check Forgejo server logs:
kubectl logs -n gitea -l app=forgejo
Verify MinIO connectivity:
kubectl get secret minio-credential -n gitea
kubectl logs -n gitea -l app=forgejo | grep -i minio
Cannot Access Forgejo Web Interface
Problem: Forgejo web interface is not accessible at configured URL
Solution:
Verify ingress configuration:
kubectl get ingress -n gitea
kubectl describe ingress -n gitea
Check TLS certificate status:
kubectl get certificate -n gitea
kubectl describe certificate -n gitea
Verify DNS resolution:
nslookup forgejo.${DOMAIN_GITEA}
Test service connectivity:
kubectl port-forward -n gitea svc/forgejo-http 3000:3000
curl http://localhost:3000
Git Operations Fail Over SSH
Problem: Cannot clone or push repositories via SSH
Solution:
Verify SSH service is exposed:
kubectl get svc -n gitea -l app=forgejo
Check LoadBalancer external IP:
kubectl get svc -n gitea forgejo-ssh -o wide
Test SSH connectivity:
ssh -T -p 32222 git@${DOMAIN_GITEA}
Verify SSH public key is added to Forgejo account
Forgejo Runners Not Executing Jobs
Problem: CI/CD workflows remain queued or fail to execute
Solution:
Check runner pod status:
kubectl get pods -n gitea -l app=forgejo-runner
kubectl logs -n gitea -l app=forgejo-runner
Verify runner registration:
kubectl exec -n gitea -it deployment/forgejo-runner -- \
  forgejo-runner status
Check Docker-in-Docker daemon:
kubectl logs -n gitea -l app=forgejo-runner -c dind
Verify runner token secret exists:
kubectl get secret -n gitea | grep runner
Check Forgejo server can communicate with runners:
kubectl logs -n gitea -l app=forgejo | grep -i runner
Database Connection Errors
Problem: Forgejo cannot connect to PostgreSQL database
Solution:
Verify PostgreSQL cluster health:
kubectl get pods -n gitea -l cnpg.io/cluster
kubectl logs -n gitea -l cnpg.io/cluster
Test database connection:
kubectl exec -n gitea -it <postgres-pod> -- \
  psql -U postgres -c "\l"
Verify database credentials secret:
kubectl get secret -n gitea -o yaml | grep POSTGRES
Check database connection from Forgejo pod:
kubectl exec -n gitea -it <forgejo-pod> -- \
  nc -zv <postgres-host> 5432
Storage Issues
Problem: Repository pushes fail or object storage errors occur
Solution:
Check PVC status and capacity:
kubectl get pvc -n gitea
kubectl describe pvc -n gitea
Verify MinIO credentials and connectivity:
kubectl get secret minio-credential -n gitea
kubectl logs -n gitea -l app=forgejo | grep -i "s3\|minio"
Check available storage space:
kubectl exec -n gitea -it <forgejo-pod> -- df -h
Review storage class configuration:
kubectl get storageclass csi-disk -o yaml
Additional Resources
2.6 - Observability
Comprehensive monitoring, metrics, and logging for Kubernetes infrastructure
Overview
The Observability stack provides enterprise-grade monitoring, metrics collection, and logging capabilities for the Edge Developer Platform. Built on VictoriaMetrics and Grafana, it offers a complete observability solution with pre-configured dashboards, alerting, and SSO integration.
The stack deploys VictoriaMetrics for metrics storage and querying, Grafana for visualization, VictoriaLogs for log aggregation, and VMAuth for authenticated access to monitoring endpoints.
Key Features
- Metrics Collection: VictoriaMetrics-based Kubernetes monitoring with long-term storage
- Visualization: Grafana with pre-built dashboards for ArgoCD, Ingress-Nginx, and infrastructure components
- Log Aggregation: VictoriaLogs for centralized logging with Grafana integration
- SSO Integration: OAuth authentication through Dex with role-based access control
- Alerting: Alertmanager with email notifications for critical events
- Secure Access: TLS-enabled ingress with authentication proxy (VMAuth)
- Persistent Storage: Encrypted volumes with configurable retention policies
Repository
Code: Observability Stack Templates
Documentation:
Getting Started
Prerequisites
- Kubernetes cluster with ArgoCD installed (provided by
core stack) - Ingress controller configured (provided by
otc stack) - cert-manager for TLS certificate management (provided by
otc stack) - Dex SSO provider (provided by
core stack) - Infrastructure deployed through Infra Deploy
Quick Start
The Observability stack is deployed as part of the EDP installation process:
Trigger Deploy Pipeline
- Go to Infra Deploy Pipeline
- Click on Run workflow
- Enter a name in “Select environment directory to deploy”. This must be DNS Compatible. (if you enter
test-me then domains will be vmauth.test-me.t09.de and grafana.test-me.t09.de) - Execute workflow
ArgoCD Synchronization
ArgoCD automatically deploys:
- VictoriaMetrics Operator and components
- VictoriaMetrics Single (metrics storage)
- VMAuth (authentication proxy)
- Alertmanager (alerting)
- Grafana Operator
- Grafana instance with OAuth
- VictoriaLogs datasource
- Pre-configured dashboards
- Ingress configurations with TLS
Verification
Verify the Observability deployment:
# Check ArgoCD applications status
kubectl get application grafana-operator -n argocd
kubectl get application victoria-k8s-stack -n argocd

# Verify VictoriaMetrics components are running
kubectl get pods -n observability

# Check Grafana instance status
kubectl get grafana grafana -n observability

# Verify ingress configurations
kubectl get ingress -n observability
Access the monitoring interfaces:
- Grafana:
https://grafana.{DOMAIN_O12Y}
Architecture
Component Architecture
The Observability stack consists of multiple integrated components:
VictoriaMetrics Components:
- VictoriaMetrics Operator: Manages VictoriaMetrics custom resources
- VictoriaMetrics Single: Standalone metrics storage with 20Gi storage and 1-month retention
- VMAgent: Scrapes metrics from Kubernetes components (kubelet, CoreDNS, kube-apiserver, etcd)
- VMAuth: Authentication proxy on port 8427 for secure metrics access
- VMAlertmanager: Handles alert routing and notifications
Grafana Components:
- Grafana Operator: Manages Grafana instances and dashboards as Kubernetes resources
- Grafana Instance: Web application for metrics visualization with OAuth authentication
- Pre-configured Dashboards: ArgoCD, Ingress-Nginx, VictoriaLogs monitoring
Logging:
- VictoriaLogs: Log aggregation service integrated as Grafana datasource
Storage:
- VictoriaMetrics Single: 20Gi persistent storage on
csi-disk storage class - Grafana: 10Gi persistent storage on
csi-disk storage class with KMS encryption - Configurable retention: 1 month for metrics, minimum 24 hours enforced
Networking:
- Nginx ingress with TLS termination for Grafana and VMAuth
- cert-manager integration for automatic certificate management
- Internal ClusterIP services for component communication
Configuration
VictoriaMetrics Configuration
Key configuration in stacks/observability/victoria-k8s-stack/values.yaml:
Operator Settings:
victoria-metrics-operator:
  enabled: true
  operator:
    enable_converter_ownership: true
  admissionWebhooks:
    certManager:
      enabled: true
      issuer:
        name: main
Storage Configuration:
vmsingle:
  enabled: true
  spec:
    retentionPeriod: "1"
    storage:
      storageClassName: csi-disk
      resources:
        requests:
          storage: 20Gi
VMAuth Configuration:
vmauth:
  enabled: true
  spec:
    port: "8427"
  ingress:
    enabled: true
    ingressClassName: nginx
    hosts:
      - name: "{{{ .Env.DOMAIN_O12Y }}}"
    tls:
      - secretName: vmauth-tls-secret
        hosts:
          - "{{{ .Env.DOMAIN_O12Y }}}"
    annotations:
      cert-manager.io/cluster-issuer: main
Monitoring Targets:
- Kubelet (cadvisor, probes, resources metrics)
- CoreDNS
- etcd
- kube-apiserver
Disabled Collectors (to avoid alerts on managed clusters):
- kube-controller-manager
- kube-scheduler
- kube-proxy
Alertmanager Configuration
Email alerting configured in values.yaml:
alertmanager:
  spec:
    externalURL: "https://{{{ .Env.DOMAIN_O12Y }}}"
    configSecret: vmalertmanager-config
  config:
    route:
      routes:
        - matchers:
            - severity =~ "critical|major"
          receiver: mail
    receivers:
      - name: 'mail'
        email_configs:
          - to: 'alerts@example.com'
            from: 'monitoring@example.com'
            smarthost: 'mail.mms-support.de:465'
            auth_username:
              name: email-user-credentials
              key: username
            auth_password:
              name: email-user-credentials
              key: password
Grafana Configuration
Grafana instance configuration in stacks/observability/grafana-operator/manifests/grafana.yaml:
OAuth/SSO Integration:
config:
  auth.generic_oauth:
    enabled: "true"
    disable_login_form: "true"
    client_id: "$__env{GF_AUTH_GENERIC_OAUTH_CLIENT_ID}"
    client_secret: "$__env{GF_AUTH_GENERIC_OAUTH_CLIENT_SECRET}"
    scopes: "openid email profile offline_access groups"
    auth_url: "https://dex.{DOMAIN}/auth"
    token_url: "https://dex.{DOMAIN}/token"
    api_url: "https://dex.{DOMAIN}/userinfo"
    role_attribute_path: "contains(groups[*], 'DevFW') && 'Admin' || 'Viewer'"
Storage:
deployment:
  spec:
    template:
      spec:
        volumes:
          - name: grafana-data
            persistentVolumeClaim:
              claimName: grafana-pvc

persistentVolumeClaim:
  spec:
    storageClassName: csi-disk
    accessModes:
      - ReadWriteOnce
    resources:
      requests:
        storage: 10Gi
Ingress:
ingress:
  spec:
    ingressClassName: nginx
    rules:
      - host: "{{{ .Env.DOMAIN_GRAFANA }}}"
        http:
          paths:
            - path: /
              pathType: Prefix
              backend:
                service:
                  name: grafana-service
                  port:
                    number: 3000
    tls:
      - hosts:
          - "{{{ .Env.DOMAIN_GRAFANA }}}"
        secretName: grafana-tls-secret
ArgoCD Application Configuration
Grafana Operator Application (template/stacks/observability/grafana-operator.yaml):
- Name:
grafana-operator - Chart:
grafana-operator v5.18.0 from ghcr.io/grafana/helm-charts - Automated sync with self-healing enabled
- Namespace:
observability
VictoriaMetrics Stack Application (template/stacks/observability/victoria-k8s-stack.yaml):
- Name:
victoria-k8s-stack - Chart:
victoria-metrics-k8s-stack v0.48.1 from https://victoriametrics.github.io/helm-charts/ - Automated self-healing enabled
- Creates namespace automatically
Usage Examples
Accessing Grafana
Access Grafana through SSO:
Navigate to Grafana
open https://grafana.${DOMAIN_GRAFANA}
Authenticate via Dex
- Click “Sign in with OAuth”
- Authenticate through configured identity provider
- Users in
DevFW group receive Admin role, others receive Viewer role
Querying Metrics
Query VictoriaMetrics directly:
# Access VMAuth endpoint
curl -u username:password https://vmauth.${DOMAIN_O12Y}/api/v1/query \
  -d 'query=up' | jq

# Query pod CPU usage
curl -u username:password https://vmauth.${DOMAIN_O12Y}/api/v1/query \
  -d 'query=container_cpu_usage_seconds_total' | jq

# Query with time range
curl -u username:password https://vmauth.${DOMAIN_O12Y}/api/v1/query_range \
  -d 'query=container_memory_usage_bytes' \
  -d 'start=2024-01-01T00:00:00Z' \
  -d 'end=2024-01-01T23:59:59Z' \
  -d 'step=5m' | jq
Creating Custom Dashboards
Create custom Grafana dashboards as Kubernetes resources:
apiVersion: grafana.integreatly.org/v1beta1
kind: GrafanaDashboard
metadata:
  name: custom-app-dashboard
  namespace: observability
spec:
  instanceSelector:
    matchLabels:
      dashboards: "grafana"
  json: |
    {
      "dashboard": {
        "title": "Custom Application Metrics",
        "panels": [
          {
            "title": "Request Rate",
            "targets": [
              {
                "expr": "rate(http_requests_total[5m])",
                "datasource": "VictoriaMetrics"
              }
            ]
          }
        ]
      }
    }
Apply the dashboard:
kubectl apply -f custom-dashboard.yaml
Viewing Logs in Grafana
Access VictoriaLogs through Grafana:
- Navigate to Grafana
https://grafana.${DOMAIN_GRAFANA} - Go to Explore
- Select “VictoriaLogs” datasource
- Use LogQL queries:
{namespace="default"}
{app="nginx"} |= "error"
{namespace="observability"} | json | level="error"
Setting Up Custom Alerts
Create custom alert rules using VMRule:
apiVersion: operator.victoriametrics.com/v1beta1
kind: VMRule
metadata:
  name: custom-app-alerts
  namespace: observability
spec:
  groups:
    - name: custom-app
      interval: 30s
      rules:
        - alert: HighErrorRate
          expr: rate(http_requests_total{status=~"5.."}[5m]) > 0.05
          for: 5m
          labels:
            severity: critical
          annotations:
            summary: "High error rate detected"
            description: "Error rate is {{ $value }} requests/sec"
Push the alert rule to stacks instances
Integration Points
- Core Stack: Depends on ArgoCD for deployment orchestration
- OTC Stack: Requires ingress-nginx controller and cert-manager for external access and TLS
- Dex (SSO): Integrated for Grafana authentication with role-based access control
- All Platform Services: Automatically collects metrics from Kubernetes components and platform services
- Application Stacks: Provides monitoring for Coder, Forgejo, and other deployed services
Troubleshooting
VictoriaMetrics Pods Not Starting
Problem: VictoriaMetrics components remain in Pending or CrashLoopBackOff state
Solution:
Check VictoriaMetrics resources:
kubectl get vmsingle,vmagent,vmalertmanager -n observability
kubectl describe vmsingle vmsingle -n observability
Verify persistent volume claims:
kubectl get pvc -n observability
kubectl describe pvc vmstorage-vmsingle-0 -n observability
Check operator logs:
kubectl logs -n observability -l app.kubernetes.io/name=victoria-metrics-operator
Grafana Not Accessible
Problem: Grafana web interface is not accessible at configured URL
Solution:
Verify Grafana instance status:
kubectl get grafana grafana -n observability
kubectl describe grafana grafana -n observability
Check Grafana pod logs:
kubectl logs -n observability -l app=grafana
Verify ingress configuration:
kubectl get ingress -n observability
kubectl describe ingress grafana-ingress -n observability
Check TLS certificate status:
kubectl get certificate -n observability
kubectl describe certificate grafana-tls-secret -n observability
OAuth Authentication Failing
Problem: Cannot authenticate to Grafana via SSO
Solution:
Verify Dex is running:
kubectl get pods -n core -l app=dex
kubectl logs -n core -l app=dex
Check OAuth client secret:
kubectl get secret dex-grafana-client -n observability
kubectl describe secret dex-grafana-client -n observability
Review Grafana OAuth configuration:
kubectl get grafana grafana -n observability -o yaml | grep -A 20 auth.generic_oauth
Check Grafana logs for OAuth errors:
kubectl logs -n observability -l app=grafana | grep -i oauth
Metrics Not Appearing
Problem: Metrics not showing up in Grafana or VictoriaMetrics
Solution:
Check VMAgent scraping status:
kubectl get vmagent -n observability
kubectl logs -n observability -l app.kubernetes.io/name=vmagent
Verify service monitors are created:
kubectl get vmservicescrape -n observability
kubectl get vmpodscrape -n observability
Check target endpoints:
# Access VMAgent UI (port-forward if needed)
kubectl port-forward -n observability svc/vmagent 8429:8429
open http://localhost:8429/targets
Verify VictoriaMetrics Single is accepting data:
kubectl logs -n observability -l app.kubernetes.io/name=vmsingle
Alerts Not Sending
Problem: Alertmanager not sending email notifications
Solution:
Verify Alertmanager configuration:
kubectl get vmalertmanager -n observability
kubectl describe vmalertmanager vmalertmanager -n observability
Check email credentials secret:
kubectl get secret email-user-credentials -n observability
kubectl describe secret email-user-credentials -n observability
Review Alertmanager logs:
kubectl logs -n observability -l app.kubernetes.io/name=vmalertmanager
Test alert firing manually:
# Access Alertmanager UI
kubectl port-forward -n observability svc/vmalertmanager 9093:9093
open http://localhost:9093
High Storage Usage
Problem: VictoriaMetrics storage running out of space
Solution:
Check current storage usage:
kubectl exec -it -n observability vmsingle-0 -- df -h /storage
Reduce retention period in values.yaml:
vmsingle:
  spec:
    retentionPeriod: "15d"  # Reduce from 1 month
Increase PVC size:
kubectl patch pvc vmstorage-vmsingle-0 -n observability \
  -p '{"spec":{"resources":{"requests":{"storage":"50Gi"}}}}'
Monitor storage metrics in Grafana for capacity planning
Additional Resources
2.7 - Observability Client
Core observability components for metrics collection, log aggregation, and monitoring
Overview
The Observability Client stack provides essential monitoring and observability infrastructure for Kubernetes environments. As part of the Edge Developer Platform, it deploys client-side components that collect, process, and forward metrics and logs to centralized observability systems.
The stack integrates three core components: Kubernetes Metrics Server for resource metrics, Vector for log collection and forwarding, and Victoria Metrics for comprehensive metrics monitoring and alerting.
Key Features
- Resource Metrics: Real-time CPU and memory metrics via Kubernetes Metrics Server
- Log Aggregation: Unified log collection and forwarding with Vector
- Metrics Monitoring: Comprehensive metrics collection, storage, and alerting with Victoria Metrics
- Prometheus Compatibility: Full Prometheus protocol support for metrics scraping
- Multi-Tenant Support: Configurable tenant isolation for metrics and logs
- Automated Alerting: Pre-configured alert rules with Alertmanager integration
- Grafana Integration: Built-in dashboard provisioning and datasource configuration
Repository
Code: Observability Client Stack Templates
Documentation:
Getting Started
Prerequisites
- Kubernetes cluster with ArgoCD installed (provided by
core stack) - cert-manager for certificate management (provided by
otc stack) - Observability backend services for receiving metrics and logs
Quick Start
The Observability Client stack is deployed as part of the EDP installation process:
Trigger Deploy Pipeline
- Go to Infra Deploy Pipeline
- Click on Run workflow
- Enter a name in “Select environment directory to deploy”. This must be DNS Compatible.
- Execute workflow
ArgoCD Synchronization
ArgoCD automatically deploys:
- Metrics Server (Helm chart v3.12.2)
- Vector agent (Helm chart v0.43.0)
- Victoria Metrics k8s-stack (Helm chart v0.48.1)
- ServiceMonitor resources for Prometheus scraping
- Authentication secrets for remote write endpoints
Verification
Verify the Observability Client deployment:
# Check ArgoCD application status
kubectl get application -n argocd | grep -E "metrics-server|vector|vm-client"

# Verify Metrics Server is running
kubectl get pods -n observability -l app.kubernetes.io/name=metrics-server

# Test metrics API
kubectl top nodes
kubectl top pods -A

# Verify Vector pods are running
kubectl get pods -n observability -l app.kubernetes.io/name=vector

# Check Victoria Metrics components
kubectl get pods -n observability -l app.kubernetes.io/name=victoria-metrics-k8s-stack

# Verify ServiceMonitor resources
kubectl get servicemonitor -n observability
Architecture
Component Architecture
The Observability Client stack consists of three integrated components:
Metrics Server:
- Collects resource metrics (CPU, memory) from kubelet
- Provides Metrics API for kubectl top and HPA
- Lightweight aggregator for cluster-wide resource usage
- Exposes ServiceMonitor for Prometheus scraping
Vector Agent:
- DaemonSet deployment for log collection across all nodes
- Processes and transforms Kubernetes logs
- Forwards logs to centralized Elasticsearch backend
- Injects cluster metadata and environment information
- Supports compression and bulk operations
Victoria Metrics Stack:
- VMAgent: Scrapes metrics from Kubernetes components and applications
- VMAlertmanager: Manages alert routing and notifications
- VMOperator: Manages VictoriaMetrics CRDs and lifecycle
- Integration with remote Victoria Metrics storage
- Supports multi-tenant metrics isolation
Data Flow
Kubernetes Resources → Metrics Server → Metrics API
                                      ↓
                                ServiceMonitor → VMAgent → Remote VictoriaMetrics

Application Logs → Vector Agent → Transform → Remote Elasticsearch

Prometheus Exporters → VMAgent → Remote VictoriaMetrics → VMAlertmanager
Configuration
Metrics Server Configuration
Configured in stacks/observability-client/metrics-server/values.yaml:
metrics:
  enabled: true
serviceMonitor:
  enabled: true
Key Settings:
- Enables metrics collection endpoint
- Exposes ServiceMonitor for Prometheus-compatible scraping
- Deployed via Helm chart from
https://kubernetes-sigs.github.io/metrics-server/
Vector Configuration
Configured in stacks/observability-client/vector/values.yaml:
Role: Agent (DaemonSet deployment across nodes)
Authentication:
Credentials sourced from simple-user-secret:
VECTOR_USER: Username for remote write authenticationVECTOR_PASSWORD: Password for remote write authentication
Data Sources:
k8s: Collects Kubernetes container logsinternal_metrics: Gathers Vector internal metrics
Log Processing:
transforms:
  parser:
    - Parse JSON from log messages
    - Inject cluster environment metadata
    - Remove original message field
Output Sink:
- Elasticsearch bulk API (v8)
- Basic authentication with environment variables
- Gzip compression enabled
- Custom headers: AccountID and ProjectID
Victoria Metrics Stack Configuration
Configured in stacks/observability-client/vm-client-stack/values.yaml:
Operator Settings:
- Enabled with admission webhooks
- Managed by cert-manager for ArgoCD compatibility
VMAgent Configuration:
- Basic authentication for remote write
- Credentials from
vm-remote-write-secret - Stream parsing enabled
- Drop original labels to reduce memory footprint
Monitoring Targets:
- Node exporter for hardware metrics
- kube-state-metrics for Kubernetes object states
- Kubelet metrics (cadvisor)
- Kubernetes control plane components (API server, etcd, scheduler, controller manager)
- CoreDNS metrics
Alertmanager Integration:
- Slack notification templates
- Configurable routing rules
- TLS support for secure communication
Storage Options:
- VMSingle: Single-node deployment
- VMCluster: Distributed deployment with replication
- Configurable retention period
ArgoCD Application Configuration
Metrics Server Application (template/stacks/observability-client/metrics-server.yaml):
- Name:
metrics-server - Chart version: 3.12.2
- Automated sync with self-heal enabled
- Namespace:
observability
Vector Application (template/stacks/observability-client/vector.yaml):
- Name:
vector - Chart version: 0.43.0
- Automated sync with self-heal enabled
- Namespace:
observability
Victoria Metrics Application (template/stacks/observability-client/vm-client-stack.yaml):
- Name:
vm-client - Chart version: 0.48.1
- Automated sync with self-heal enabled
- Namespace:
observability - References manifests from instance repository
Usage Examples
Querying Resource Metrics
Access resource metrics collected by Metrics Server:
# View node resource usage
kubectl top nodes

# View pod resource usage across all namespaces
kubectl top pods -A

# View pod resource usage in specific namespace
kubectl top pods -n observability

# Sort pods by CPU usage
kubectl top pods -A --sort-by=cpu

# Sort pods by memory usage
kubectl top pods -A --sort-by=memory
Using Metrics for Autoscaling
Create Horizontal Pod Autoscaler based on metrics:
apiVersion: autoscaling/v2
kind: HorizontalPodAutoscaler
metadata:
  name: myapp-hpa
spec:
  scaleTargetRef:
    apiVersion: apps/v1
    kind: Deployment
    name: myapp
  minReplicas: 2
  maxReplicas: 10
  metrics:
  - type: Resource
    resource:
      name: cpu
      target:
        type: Utilization
        averageUtilization: 70
Accessing Application Logs
Vector automatically collects logs from all containers. View logs in your centralized Elasticsearch/Kibana:
# Logs are automatically forwarded to Elasticsearch
# Access via Kibana dashboard or Elasticsearch API

# Example: Query logs via Elasticsearch API
curl -u $VECTOR_USER:$VECTOR_PASSWORD \
  -X GET "https://elasticsearch.example.com/_search" \
  -H 'Content-Type: application/json' \
  -d '{
    "query": {
      "match": {
        "kubernetes.namespace": "my-namespace"
      }
    }
  }'
Querying Victoria Metrics
Query metrics collected by Victoria Metrics:
# Access Victoria Metrics query API
# Metrics are forwarded to remote Victoria Metrics instance

# Example PromQL queries:
# - Container CPU usage: container_cpu_usage_seconds_total
# - Pod memory usage: container_memory_usage_bytes
# - Node disk I/O: node_disk_io_time_seconds_total

# Query via Victoria Metrics API
curl -X POST https://victoriametrics.example.com/api/v1/query \
  -d 'query=up' \
  -d 'time=2025-12-16T00:00:00Z'
Creating Custom ServiceMonitors
Expose application metrics for collection:
apiVersion: v1
kind: Service
metadata:
  name: myapp-metrics
  labels:
    app: myapp
spec:
  ports:
  - name: metrics
    port: 8080
    targetPort: 8080
  selector:
    app: myapp
---
apiVersion: monitoring.coreos.com/v1
kind: ServiceMonitor
metadata:
  name: myapp-monitor
  namespace: observability
spec:
  selector:
    matchLabels:
      app: myapp
  endpoints:
  - port: metrics
    path: /metrics
    interval: 30s
Integration Points
- Core Stack: Depends on ArgoCD for deployment orchestration
- OTC Stack: Requires cert-manager for certificate management
- Observability Stack: Forwards metrics and logs to centralized observability backend
- All Application Stacks: Collects metrics and logs from all platform applications
Troubleshooting
Metrics Server Not Responding
Problem: kubectl top commands fail or return no data
Solution:
Check Metrics Server pod status:
kubectl get pods -n observability -l app.kubernetes.io/name=metrics-server
kubectl logs -n observability -l app.kubernetes.io/name=metrics-server
Verify kubelet metrics endpoint:
kubectl get --raw /apis/metrics.k8s.io/v1beta1/nodes
Check ServiceMonitor configuration:
kubectl get servicemonitor -n observability -o yaml
Vector Not Forwarding Logs
Problem: Logs are not appearing in Elasticsearch
Solution:
Check Vector agent status:
kubectl get pods -n observability -l app.kubernetes.io/name=vector
kubectl logs -n observability -l app.kubernetes.io/name=vector --tail=50
Verify authentication secret:
kubectl get secret simple-user-secret -n observability
kubectl get secret simple-user-secret -n observability -o jsonpath='{.data.username}' | base64 -d
Test Elasticsearch connectivity:
kubectl exec -it -n observability $(kubectl get pod -n observability -l app.kubernetes.io/name=vector -o jsonpath='{.items[0].metadata.name}') -- \
  curl -u $VECTOR_USER:$VECTOR_PASSWORD https://elasticsearch.example.com/_cluster/health
Check Vector internal metrics:
kubectl port-forward -n observability svc/vector 9090:9090
curl http://localhost:9090/metrics
Victoria Metrics Not Scraping
Problem: Metrics are not being collected or forwarded
Solution:
Check VMAgent status:
kubectl get pods -n observability -l app.kubernetes.io/name=vmagent
kubectl logs -n observability -l app.kubernetes.io/name=vmagent
Verify remote write secret:
kubectl get secret vm-remote-write-secret -n observability
kubectl get secret vm-remote-write-secret -n observability -o jsonpath='{.data.username}' | base64 -d
Check ServiceMonitor targets:
kubectl get servicemonitor -n observability
kubectl describe servicemonitor metrics-server -n observability
Verify operator is running:
kubectl get pods -n observability -l app.kubernetes.io/name=victoria-metrics-operator
kubectl logs -n observability -l app.kubernetes.io/name=victoria-metrics-operator
High Memory Usage
Problem: Victoria Metrics or Vector consuming excessive memory
Solution:
For Victoria Metrics, verify dropOriginalLabels is enabled:
kubectl get vmagent -n observability -o yaml | grep dropOriginalLabels
Reduce scrape intervals for high-cardinality metrics:
# Edit ServiceMonitor
spec:
  endpoints:
  - interval: 60s  # Increase from 30s
Filter unnecessary logs in Vector:
# Add filter transform to Vector configuration
transforms:
  filter:
    type: filter
    condition: '.kubernetes.namespace != "kube-system"'
Check resource limits:
kubectl describe pod -n observability -l app.kubernetes.io/name=vmagent
kubectl describe pod -n observability -l app.kubernetes.io/name=vector
Certificate Issues
Problem: TLS certificate errors in logs
Solution:
Verify cert-manager is running:
kubectl get pods -n cert-manager
Check certificate status:
kubectl get certificate -n observability
kubectl describe certificate -n observability
Review webhook configuration:
kubectl get validatingwebhookconfigurations | grep victoria-metrics
kubectl get mutatingwebhookconfigurations | grep victoria-metrics
Restart operator if needed:
kubectl rollout restart deployment victoria-metrics-operator -n observability
Additional Resources