Edge Developer Platform
A platform to support developers working in the Edge, based around Forgejo
Purpose
The Edge Developer Platform (EDP) is a comprehensive DevOps platform designed to enable developers to build, deploy, and operate cloud-native applications at the edge. It provides an integrated suite of tools and services covering the entire software development lifecycle.
Loading architecture diagram...
The magenta EDP represents the developer platform: a shared, productized layer that enables modern DevOps by standardizing how applications are described, built, deployed, and observed. In the inner loop, developers iterate locally (fast feedback: code → run → test). EDP then connects that work to an outer loop where additional roles (review, test, operations, audit/compliance) contribute feedback and controls for production readiness.
In this modern DevOps setup, EDP acts as the hub: it synchronizes with local development and deploys applications to target clouds (for example, an EdgeConnect cloud), while providing the operational capabilities needed to run them safely. Agentic AI can support both loops—for example by assisting developers with implementation and testing in the inner loop, and by automating reviews, policy checks, release notes, and deployment verification (including drift detection and remediation) in the outer loop.
Product Structure
EDP consists of multiple integrated components organized in layers:
The foundation layer provides essential platform capabilities including source code management, CI/CD, and container orchestration.
For documentation, see: Basic Platform Concepts and Forgejo
Developer Experience
Tools and services that developers interact with directly to build, test, and deploy applications.
For documentation, see: Forgejo and Deployment
CI/CD Optimization
Tools for right-sizing CI/CD runner resources, tracking energy consumption, and reducing carbon footprint.
For documentation, see: CI Sizer
Container Supply Chain
Zero-trust reproducible container base images and supply chain verification for the platform.
For documentation, see: StageX Container Images
Infrastructure & Operations
Infrastructure automation, observability, and operational tooling for platform management.
For documentation, see: Operations and Infrastructure as Code
Getting Started
EDP is available at https://edp.buildth.ing.
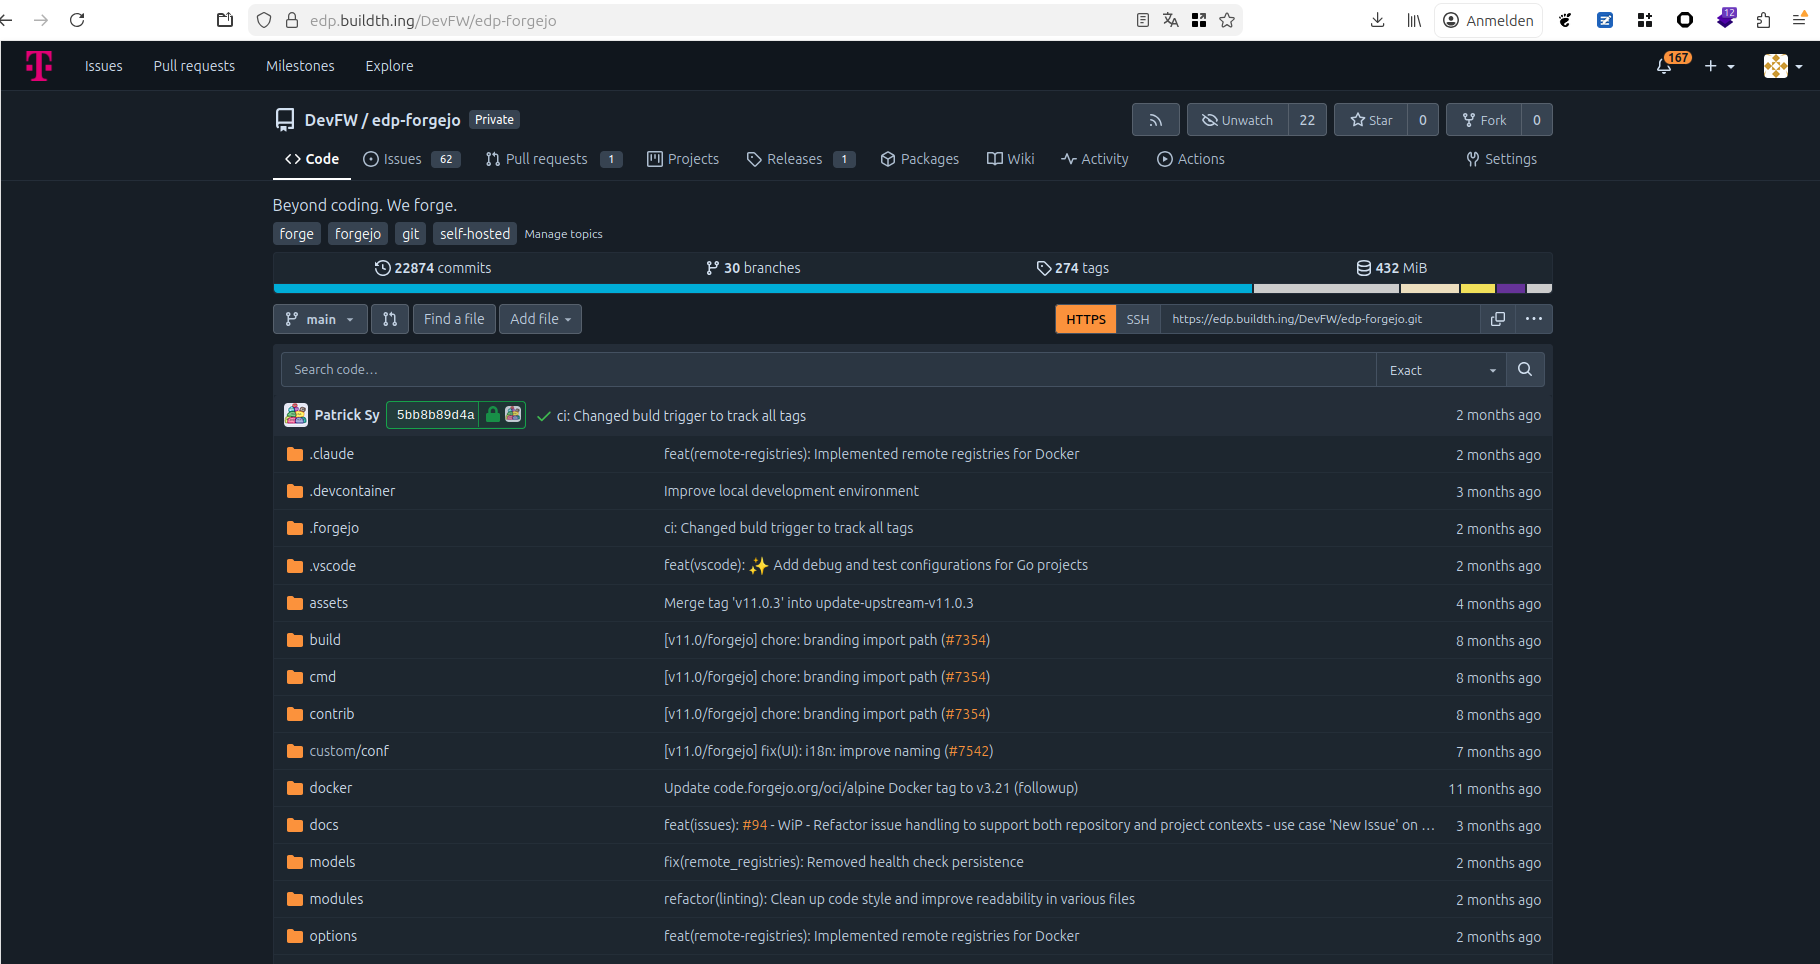
EDP includes a Forgejo instance that hosts both public and private repositories containing all EDP components.
To request access and get onboarded, start with the welcome repository:
Once you have access to the repositories, you can explore the EDP documentation according to the product structure above.
1 - Forgejo
Forgejo provides source code management, project management, and CI/CD automation for the EDP.
The internal service is officially designated as the Edge Developer Platform (EDP). It is hosted at edp.buildth.ing. The domain selection followed a democratic team process to establish a unique identity distinct from standard corporate naming conventions.
Technical Architecture & Deployment
Infrastructure Stack
The platform is hosted on the Open Telekom Cloud (OTC). The infrastructure adheres to Infrastructure-as-Code (IaC) principles.
- Deployment Method: The official Forgejo Helm Chart is deployed via ArgoCD.
- Infrastructure Provisioning: Terraform is used to provision all underlying OTC services, including:
- Container Orchestration: CCE (Cloud Container Engine): Kubernetes
- Database: RDS (Distributed Cache Service): PostgreSQL
- Caching: DCS (Distributed Cache Service): Redis
- Object Storage: OBS (Object Storage Service, S3-compatible): for user data (avatars, attachments).
- Search: CSS (Cloud Search Service): Elasticsearch
The “Self-Replicating” Pipeline
A key architectural feature is the ability of the platform to maintain itself. A Forgejo Action can trigger the deployment script, which runs Terraform and syncs ArgoCD, effectively allowing “Forgejo to create/update Forgejo.”
graph TD
    subgraph "Open Telekom Cloud (OTC)"
        subgraph "Control Plane"
            Dev[DevOps Engineer] -->|Triggers| Pipeline[Deployment Pipeline]
            Pipeline -->|Executes| TF[Terraform]
        end

        subgraph "Provisioned Infrastructure"
            TF -->|Provisions| CCE[(CCE K8s Cluster)]
            TF -->|Provisions| RDS[(RDS PostgreSQL)]
            TF -->|Provisions| Redis[(DCS Redis)]
            TF -->|Provisions| S3[(OBS S3 Bucket)]
            TF -->|Provisions| CSS[(CSS Elasticsearch)]
        end

        subgraph "Application Layer (on CCE K8s)"
            Pipeline -->|Helm Chart| Argo[ArgoCD]
            Argo -->|Deploys| ForgejoApp[Forgejo]
        end

        CCE -- Runs --> Argo
        CCE -- Runs --> ForgejoApp
        ForgejoApp -->|Connects| RDS
        ForgejoApp -->|Connects| Redis
        ForgejoApp -->|Connects| S3
        ForgejoApp -->|Connects| CSS
    end
Migration History
The initial environment was a manual setup on the Open Sovereign Cloud (OSC). Once the automation stack (Terraform/ArgoCD) was matured, the platform was migrated to the current OTC environment.
Application Extensions
Core Functionality
Beyond standard Git versioning, the platform utilizes:
- Releases: Hosting binaries for software distribution (e.g., Edge Connect CLI).
- CI/CD: Extensive pipeline usage for build, test, and deployment automation.
- Note on Issues: While initially used, issue tracking was migrated to JIRA to align with the broader IPCEI program standards.
GARM (Git-based Actions Runner Manager)
The primary technical innovation was the integration of GARM to enable ephemeral, scalable runners. This required extending Forgejo’s capabilities to support GitHub-compatible runner registration and webhook events.
Development Methodology & Contributions
Workflow
- Branching Strategy: Trunk-based development was utilized to ensure rapid integration.
- Collaboration: The team adopted Mob Programming. This practice proved essential for knowledge sharing and onboarding junior developers, creating a resilient and high-intensity learning environment.
- Versions: The platform evolved from Forgejo v7/8 through v11.0.3-edp1 to the current
edp-forgejo v14 (upgraded Q1 2026, IPCEICIS-7848). The Forgejo 14 upgrade resolved outstanding version lag and enabled adoption of the latest upstream GARM integration features.
Open Source Contributions
We actively contributed our extensions back to the upstream Forgejo project in a list of Codeberg.org pull requests
Artifact Caching (Pull-Through Proxy)
We implemented a feature allowing Forgejo to act as a pull-through proxy for remote container registries, optimizing bandwidth and build speeds.
A security hardening initiative was completed in Q1 2026 across the EDP platform:
Multi-Factor Authentication
MFA is now enabled and enforced for all EDP platform users at edp.buildth.ing. Users are required to configure a TOTP-compatible authenticator on next login.
Forgejo Administration Cleanup
A review of Forgejo administration accounts and service accounts was carried out. Redundant admin and bot accounts were removed or scoped down, tightening the overall access surface of the platform.
Automated Vulnerability Scanning (Trivy)
Trivy vulnerability scanning is now automated in EDP CI/CD pipelines via a Forgejo Action. Scans cover container images, source code dependencies, and IaC configurations. Results are automatically uploaded to the Dependency-Track instance for tracking and triage.
Redis Reliability Fix
Redis (the Distributed Cache Service powering Forgejo on OTC) was prone to filling up under active crawling load, causing 500 errors across Forgejo operations. An automated remediation was implemented:
- An OTC Cloud Eye alarm monitors Redis memory usage
- A notification channel triggers a cloud function when the threshold is approached
- The cloud function automatically clears Redis data before it causes Forgejo to break
This eliminates the need for manual intervention to restore Forgejo availability after Redis saturation events.
These KPIs measure the effectiveness of the Forgejo setup and quantify our strategic commitment to the Forgejo community.
| KPI | Description | Target / Benchmark |
|---|
| Deployment Frequency | Frequency of successful pipeline executions. | High (Daily/On-demand) |
| Artifact Cache Hit Rate | Percentage of build requests served by the local Forgejo proxy. | > 90% (Reduced external traffic) |
| Upstream Contribution | Percentage of GARM-related features contributed back to Codeberg. | 100% (No vendor lock-in) |
| PR Resolution Time | Average time for upstream community review and merge. | < 14 days (Healthy collaboration) |
1.1 - Forgejo Actions
GitHub Actions-compatible CI/CD automation
Overview
Forgejo Actions is a built-in CI/CD automation system that enables developers to define and execute workflows directly within their Forgejo repositories. As a continuous integration and continuous deployment platform, Forgejo Actions automates software development tasks such as building, testing, packaging, and deploying applications whenever specific events occur in your repository.
Forgejo Actions provides GitHub Actions similarity, allowing teams to easily adapt existing GitHub Actions workflows and marketplace actions with minimal or no modifications. This compatibility significantly reduces migration effort for teams transitioning from GitHub to Forgejo, while maintaining familiar syntax and workflow patterns.
Workflows are defined using YAML files stored in the .forgejo/workflows/ directory of your repository. Each workflow consists of one or more jobs that execute on action runners when triggered by repository events such as pushes, pull requests, tags, or manual dispatch. This enables automation of repetitive development tasks, ensuring consistent build and deployment processes across your software delivery pipeline.
By integrating CI/CD directly into the repository management platform, Forgejo Actions eliminates the need for external CI/CD systems, reducing infrastructure complexity and providing a unified development experience.
Key Features
- Automated Workflow Execution - Execute automated workflows triggered by repository events such as code pushes, pull requests, tag creation, or manual dispatch, enabling continuous integration and deployment without manual intervention
- GitHub Actions Similarity - Maintains similarity with GitHub Actions syntax and workflows, allowing reuse of existing actions from the GitHub marketplace and simplifying migration from GitHub-based CI/CD pipelines
Purpose in EDP
Forgejo Actions enables EDP customers to execute complete CI/CD pipelines directly on the platform for building, testing, packaging, and deploying software. This integrated automation capability is fundamental to the EDP value proposition.
Without native CI/CD automation, customers would face significant integration overhead connecting external CI/CD systems to their EDP workflows. This fragmentation would complicate pipeline management, increase operational complexity, and reduce the platform’s effectiveness as a unified development solution.
Since Forgejo Actions is natively integrated into Forgejo, EDP provides this critical CI/CD capability with minimal additional infrastructure. Customers benefit from seamless automation without requiring separate tool provisioning, authentication configuration, or cross-system integration maintenance.
Getting Started
Prerequisites
Quick Start
- Create a repository
- Create file
/.forgejo/workflows/example.yaml
# example.yaml
name: example

on:
  workflow_dispatch:

jobs:
  build:
    runs-on: ubuntu-latest
    steps:
      - name: Hello World
        run: |
          echo "Hello World!"
- Navigate to Actions > example.yaml > Run workflow
Verification
See the logs, there should appear a “Hello World!” in “Hello World” Step
Usage Examples
Use actions to deploy infrastructure
See infra-deploy repository as a example
Use goreleaser to build, test, package and release a project
This pipeline is triggered when a tag with the prefix v is pushed to the repository.
Then, it fetches the current repository with all tags and checks out the version for the current run.
After that the application is being built.
# .github/workflows/release.yaml
name: ci

on:
  push:
    tags:
      - v*

jobs:
  goreleaser:
    runs-on: ubuntu-latest
    steps:
      - name: Checkout
        uses: actions/checkout@v4
        with:
          fetch-depth: 0
      - name: Set up Go
        uses: actions/setup-go@v6
        with:
          go-version: ">=1.25.1"
      - name: Test code
        run: make test
      - name: Import GPG key
        id: import_gpg
        uses: https://github.com/crazy-max/ghaction-import-gpg@v6
        with:
          gpg_private_key: ${{ secrets.GPG_PRIVATE_KEY }}
          passphrase: ${{ secrets.GPG_PASSPHRASE }}
      - name: Run GoReleaser
        uses: https://github.com/goreleaser/goreleaser-action@v6
        env:
          GITEA_TOKEN: ${{ secrets.PACKAGES_TOKEN }}
          GPG_FINGERPRINT: ${{ steps.import_gpg.outputs.fingerprint }}
        with:
          args: release --clean
Troubleshooting
The job is not being executed by a runner
Problem: The job is not being picked up by a runner
Solution: Probably, there is currently no runner available with the label defined in your job runs-on attribute. Check the available runner for your repository by navigating to the repository settings > Actions > Runners. Now you can see all available runners and their Labels. Choose on of them as your runs-on attribute.
Status
Maturity: Production
Additional Resources
1.1.1 - Runners
Self-hosted runner infrastructure with orchestration capabilities
Overview
Action runners are the execution environment for Forgejo Actions workflows. By design, runners execute remote code submitted through CI/CD pipelines, making their architecture highly dependent on the underlying infrastructure and security requirements.
The primary objective in any runner setup is the separation and isolation of individual runs. Since runners are specifically built to execute arbitrary code from repositories, proper isolation is critical to prevent data and secret leakage between different pipeline executions. Each runner must be thoroughly cleaned or recreated after every job to ensure no residual data persists that could compromise subsequent runs.
Beyond isolation concerns, action runners represent high-value targets for supply chain attacks. Runners frequently compile, build, and package software binaries that may be distributed to thousands or millions of end users. Compromising a runner could allow attackers to inject malicious code directly into the software supply chain, making runner security a critical consideration in any deployment.
This document explores different runner architectures, examining their security characteristics, operational trade-offs, and suitability for various infrastructure environments and showing off an example deployment using a Containerized Kubernetes environment.
Key Features
- Consistent environment for Forgejo Actions
- Primary location to execute code e.g. deployments
- Good security practices essential due to broad remit
Purpose in EDP
A actions runner are executing Forgejo actions, which can be used to build, test, package and deploy software. To ensure that EDP customers do not need to provision their own action runners with high efford, we provide globally registered actions runners to pick up jobs.
Repository
Code:
Documentation: Forgejo Runner installation guide
Runner Setups
Different runner deployment architectures offer varying levels of isolation, security, and operational complexity. The choice depends on your infrastructure capabilities, security requirements, and operational overhead tolerance.
Bare metal runners execute directly on physical hardware without virtualization layers.
Advantages:
- Maximum performance with direct hardware access
- Complete hardware isolation between different physical machines
- No hypervisor overhead or virtualization complexity
Disadvantages:
- Difficult to clean after each run, requiring manual intervention or full OS reinstallation
- Long provisioning time for individual runners
- Complex provisioning processes requiring physical access or remote management tools
- Limited scalability due to physical hardware constraints
- Higher risk of persistent contamination between runs
Use case: Best suited for specialized workloads requiring specific hardware, performance-critical builds, or environments where virtualization is not available.
On Virtual Machines
VM-based runners operate within virtualized environments managed by a hypervisor.
Advantages:
- Strong isolation through hypervisor and hardware memory mapping
- Virtual machine images enable faster provisioning compared to bare metal
- Easy to snapshot, clone, and restore to clean states
- Better resource utilization through multiple VMs per physical host
- Automated cleanup by destroying and recreating VMs after each run
Disadvantages:
- Requires hypervisor infrastructure and management
- Slower provisioning than containers
- Higher resource overhead compared to containerized solutions
- More complex orchestration for scaling runner fleets
Use case: Ideal for environments requiring strong isolation guarantees, multi-tenant scenarios, or when running untrusted code from external contributors.
In Containerized Environment
Container-based runners execute within isolated containers using OCI-compliant runtimes.
Advantages:
- Kernel-level isolation using Linux namespaces and cgroups
- Fast provisioning and startup times
- Easy deployment through standardized OCI container images
- Lightweight resource usage enabling high-density runner deployments
- Simple orchestration with Kubernetes or Docker Compose
Disadvantages:
- Weaker isolation than VMs since containers share the host kernel
- Requires elevated permissions or privileged access for certain workflows (e.g., Docker-in-Docker)
- Potential kernel-level vulnerabilities affect all containers on the host
- Container escape vulnerabilities pose security risks in multi-tenant environments
Use case: Best for high-volume CI/CD workloads, trusted code repositories, and environments prioritizing speed and efficiency over maximum isolation.
Getting Started
Prerequisites
- Forgejo instance
- Runner registration token has been generated for a given scope
- Global runners in
admin settings > actions > runner > Create new runner - Organization runners in
organization settings > actions > runner > Create new runner - Repository runners in
repository settings > actions > runner > Create new runner
- Kubernetes cluster
Quick Start
- Download Kubernetes manifest
- Replace
${RUNNER_SECRET} with the runner registration token - Replace
${RUNNER_NAME} with the name the runner should have - Replace
${FORGEJO_INSTANCE_URL} with the instance url - (if namespace does not exists)
kubectl create ns gitea - Run
kubectl apply -f <file>
Verification
Take a look at the runners page, where you generated the token. There should be 3 runners in idle state now.
Sequence Diagrams
---
title: Forgejo Runner executed in daemon mode
---
sequenceDiagram
    Runner->>Forgejo: Register runner
    loop Job Workflow
    Runner->>Forgejo: Fetch job
    Runner->>Runner: Work on job
    Runner->>Forgejo: Send result
    end
Deployment Architecture
[Add infrastructure and deployment diagrams showing how the component is deployed]
Configuration
There is a sophisticated configuration file, where finetuning can be done.
The most important thing is done by using labels to define the execution environment.
The label ubuntu-latest:docker://ghcr.io/catthehacker/ubuntu:act-22.04 (as used in example runner). That a job that uses ubuntu-latest label will be executed as docker container inside the ghcr.io/catthehacker/ubuntu:act-22.04 image.
Alternatives to docker are lxc and host.
Troubleshooting
In containerized environments, I want to build container images
Problem: In containerized environment, containers usually do not have many privileges. To start or build containers additional privleges, usually root is required inside of the kernel, the container runtime needs to manage linux namespaces and cgroups.
Solution: A partial solution for this is buildkitd utilizing rootlesskit. This allows containers to be built (but not run) in a non root environment. Several examples can be found in the official buildkit repo.
Rootless vs User namespaces:
As of Kubernetes 1.33, uid mapping can be enabled for pods using pod.spec.hostUsers: false utilizing user namespaces to map user and group ids between the container ids (0-65535) to high host ids (0-65535 + n * 65536) where n is an arbitrary number of containers. This allows that the container runs with actual root permission in its user namespace without being root on the host system.
Rootless is considered the more secure version, as the executable is mapped to a privileged entitiy at all.
Status
Maturity: Beta
Additional Resources
1.1.1.1 - Runner Resource Optimization
CI/CD runner right-sizing through historical resource utilization analysis and a sustainability dashboard.
Overview
Runner Resource Optimization is a PoC feature delivered in Q1 2026 (IPCEICIS-6887) that analyses historical CPU and memory data from CI/CD pipeline executions to recommend right-sized runner configurations. Alongside it, a runner sustainability dashboard (IPCEICIS-7421) was shipped into the Forgejo runner settings page, giving users visibility into historical runner usage and current runner statuses.
The motivation is straightforward: manually choosing a runner size is guesswork. Developers tend to over-provision to avoid failures, leaving compute unused and energy wasted. By using real utilization data, the system can suggest the smallest runner that still safely completes the job.
Key Features
- Historical utilization analysis: Collects CPU and memory metrics at 10-second intervals across pipeline runs and retains 30 days of data
- Right-sizing recommendations: Calculates peak and average resource consumption per pipeline/job type and recommends the smallest runner size with a 20% safety margin above peak usage
- Runner sustainability dashboard: Embedded in the Forgejo runner settings page — shows which runners were used in workflow jobs, historical usage trends, and current runner statuses
- Workflow execution metrics collection: Gathers structured per-job metrics to feed the recommendation algorithm (IPCEICIS-7413)
Purpose in EDP
CI/CD runners are the largest variable compute cost in the EDP. Most users default to a fixed runner size regardless of actual job requirements. This feature closes that gap by:
- Surfacing utilization data that would otherwise be invisible
- Giving teams actionable, evidence-based recommendations without requiring deep infrastructure knowledge
- Tracking runner usage per project, supporting sustainability reporting (“which runners powered my workflows?”)
How the Algorithm Works
The recommendation algorithm operates as follows for a given pipeline/job type:
- Collect: Retrieve the last n runs’ CPU and memory utilization for the job
- Analyse: Calculate peak and average resource consumption across those runs
- Recommend: Identify the smallest runner size in the family (small → medium → large → xlarge) where peak usage fits within the available resources, plus a 20% safety margin
- Output: Present current runner size vs. recommended size side-by-side
Example output:
  Job: build-and-test
  Current runner: large  (8 vCPU, 16 GB RAM)
  Peak CPU:  2.4 vCPU   Peak RAM: 5.8 GB
  Recommended: medium    (4 vCPU, 8 GB RAM)  [peak + 20% margin fits]
The recommendation is conservative by design: it does not auto-apply changes. Teams review and opt-in, avoiding surprise failures.
Runner Sustainability Dashboard
The dashboard is accessible from the Forgejo runner settings page (same permission scope as the runner list). It provides:
| Panel | Description |
|---|
| Current runner status | Live view of idle, active, and offline runners |
| Historical usage by job | Which runner handled each workflow job and when |
| Resource utilization trends | CPU and memory over time per runner |
| Sustainability tracking | Per-project runner usage for carbon/energy attribution |
The data is surfaced without leaving Forgejo — no external dashboarding tool is required for basic usage. For deeper observability, metrics are also exported to the EDP Grafana instance at observability.buildth.ing.
Metrics Collection (IPCEICIS-7413)
Workflow execution metrics are gathered during pipeline runs with less than 5% overhead on pipeline execution time. The collected data includes:
- Job start/end timestamps
- Runner identity and size
- Peak and average CPU utilization (sampled at 10-second intervals)
- Peak and average memory utilization
- Job exit status (success/failure)
These metrics feed the recommendation algorithm and the dashboard simultaneously.
Status
Maturity: PoC — the recommendation algorithm and dashboard are functional and deployed on edp.buildth.ing. Auto-enforcement (automatic runner resizing) is explicitly out of scope for this iteration.
Additional Resources
1.1.1.2 - Orchestration with GARM
Using GARM to manage short-lived Forgejo runners
Overview
GARM provides on-demand runner orchestration for Forgejo Actions through dynamic autoscaling. As Forgejo has similar API structure to Gitea (from which it was forked), GARM’s Gitea/GitHub compatibility makes it a natural fit for automated runner provisioning. GARM supports custom providers, enabling runner infrastructure deployment across multiple cloud and infrastructure platforms.
A custom edge-connect provider was implemented for GARM to enable infrastructure provisioning. Additionally, Forgejo was adapted to align more closely with Gitea’s API, ensuring seamless integration with GARM’s orchestration capabilities.
Key Features
- Autoscales Forgejo Actions runners dynamically based on workload demand
- Leverages edge-connect infrastructure for distributed runner provisioning
Purpose in EDP
- Provides CI/CD infrastructure for all software development projects
- Enhances the EDP platform capabilities through improved Forgejo automation
- Enables teams to focus on development by consuming platform-managed runners without capacity planning concerns
Repository
Code:
Getting Started
Prerequisites
- Container Runtime installed (e.g. docker)
- Forgejo, Gitea or Github
Quick Start
- Clone the GARM Provider repository
- Build the Docker image:
docker buildx build -t <your-image-tag> . - Push the image to your container registry
- Deploy GARM using the deployment script from the infra-deploy repository, targeting your Kubernetes cluster:
./local-helm.sh --garm
Verification
- Verify the GARM pod is running:
kubectl get pods -n garm - Retrieve the GARM domain endpoint:
kubectl get ing -n garm - Get the GARM admin password:
kubectl get secret -n garm garm-credentials -o json | jq .data.GARM_ADMIN_PASSWORD -r | base64 -d - Configure endpoints, credentials, repositories, and runner pools in GARM as described in the garm-provider-test repository.
Integration Points
- Forgejo: Picks up pending action jobs, listen in Forgejo
- Edge Connect: Uses this infrastructure to deploy runners that can pick up open jobs in forgejo
Architecture
The primary technical innovation was the integration of GARM to enable ephemeral, scalable runners. This required extending Forgejo’s capabilities to support GitHub-compatible runner registration and webhook events.
Workflow Architecture:
- Event: A workflow event occurs in Forgejo.
- Trigger: A webhook notifies GARM.
- Provisioning: GARM spins up a fresh, ephemeral runner.
- Execution: The runner registers via the API, executes the job, and is terminated immediately after, ensuring a clean build environment.
sequenceDiagram
    participant User
    participant Forgejo
    participant GARM
    participant Runner as Ephemeral Runner

    User->>Forgejo: Push Code / Trigger Event
    Forgejo->>GARM: Webhook Event (Workflow Dispatch)
    GARM->>Forgejo: Register Runner (via API)
    GARM->>Runner: Spin up Instance
    Runner->>Forgejo: Request Job
    Forgejo->>Runner: Send Job Payload
    Runner->>Runner: Execute Steps
    Runner->>Forgejo: Report Status
    GARM->>Runner: Terminate (Ephemeral)
Sequence Diagrams
The diagram below shows how a trigger of an action results in deployment of a runner on edge-connect.
Loading architecture diagram...
Deployment Architecture
Loading architecture diagram...
Configuration
Provider Setup
The config below configures an external provder for garm. Especially important is the provider.external.config_file which refers to the configuration of the external provider (example below) and provider.external.provider_executable which needs to point to the provider executable.
# config.toml
...
[[provider]]
name = "edge-connect"
description = "edge connect provider"
provider_type = "external"

[provider.external]
config_file = "/etc/garm/edge-connect-provider-config.toml"
provider_executable = "/opt/garm/providers.d/garm-provider-edge-connect"
environment_variables = ["EDP_EDGE_CONNECT_"]
# edge-connect-provider-config.toml
log_file = "/garm/provider.log"
credentials_file = "/etc/garm-creds/credentials.toml" # to authenticate agains edge_connect.url

[edge_connect]
organization = "edp-developer-framework"
region = "EU"
url = "https://hub.apps.edge.platform.mg3.mdb.osc.live"
default_flavor = "EU.small"

[edge_connect.cloudlet]
name = "Munich"
organization = "TelekomOP"
# credentials.toml for edge connect platform
username = ""
password = ""
Runner Pool Configuration
Once the configuration is in place and garm has been deployed. You can connect garm to Forgejo/Gitea/Github, using the commands below. If you have a forgejo instance, you want to create a gitea endpoint.
# https://edp.buildth.ing/DevFW/garm-deploy/src/branch/master/helm/garm/templates/init-job.yaml#L39-L56
garm-cli init --name gitea --password ${GARM_ADMIN_PASSWORD} --username ${GARM_ADMIN_USERNAME} --email ${GARM_ADMIN_EMAIL} --url ${GARM_URL}
if [ $? -ne 0 ]; then
  echo "garm maybe already initialized"
  exit 0
fi

# API_GIT_URL=https://garm-provider-test.t09.de/api/v1
# GIT_URL=https://garm-provider-test.t09.de
garm-cli gitea endpoint create \
--api-base-url ${API_GIT_URL} \
--base-url ${GIT_URL} \
--description "My first Gitea endpoint" \
--name local-gitea

garm-cli gitea credentials add \
--endpoint local-gitea \
--auth-type pat \
--pat-oauth-token $GITEA_TOKEN \
--name autotoken \
--description "Gitea token"
Now, connect to the WebUI, use GARM_ADMIN_USERNAME and GARM_ADMIN_PASSWORD as credentials to authenticate. Click on repositories and
Status
Maturity: Beta
Additional Resources
1.2 - Project Management in Forgejo
Organization-level project and issue management
Discontinued Feature
This feature was implemented at a prototype level but never reached production readiness. Development was discontinued in favor of other platform priorities.Overview
This was an attempt to extend Forgejo’s project and issue management capabilities beyond the repository level. The goal was to enable organizations and users to create projects and issues that could span multiple repositories or exist independently of any repository.
Problem Statement
Forgejo’s issue management is repository-centered. While this works well for code-specific issues, it creates challenges for broader project management:
- Cross-repository work: Tasks often span multiple repositories but must be artificially tied to one
- Non-code projects: Some projects don’t map cleanly to a repository (e.g., planning, documentation initiatives)
- Related repositories: Symbiotically related repos would benefit from shared issue tracking
Real-world examples:
Implementation Status
Status: Prototype level - basic operations work but not production-ready
What was built:
- Projects can be created at the organization/user level (not tied to repositories)
- Issues can be created within these organization-level projects
- Issues can be moved between columns within any projects
- Basic Create and View Issue pages function without errors
What was incomplete:
- Several features on Create/View pages disabled rather than adapted, e.g. due dates
- Repository-specific features (tags, code reviews, etc.) not resolved for org-level context
- Broader issue management features not yet functional
Discontinuation
Development was discontinued due to:
- Project priorities shifted to other platform features
- Scope of remaining work deemed too large for the anticipated value
- Concerns about maintaining a custom feature divergent from upstream Forgejo
Repository
Code: edp-forgejo (Remark: You must be logged into edp.buildth.ing as the repo is internal)
This is a fork of upstream Forgejo with the organization-level project management changes. The fork is based on Forgejo v11.x (upstream has progressed to at least v13.x).
Implementation: Changes to both UI (in TypeScript) and server-side (Golang) functionality.
Technical Approach
The implementation involved:
- Minimally modifying Forgejo’s data model to associate projects with organizations/users instead of repositories
- Adapting issue creation and display logic to work without repository context
- Addressing repository-specific settings (labels, milestones, code review integration) for org-level issues
- UI changes to support project creation and issue management at the organization level
Integration Points
This feature was developed as an isolated extension to Forgejo. Its code is within the edp-forgejo repository alongside other EDP updates - such as magenta colour scheme - but in terms of functionality has minimal overlap/links with other EDP components.
Lessons Learned
- Repository-centric design is deeply embedded in Forgejo’s architecture
- Maintaining custom features in a fork creates significant maintenance burden
- The scope of fully-functional cross-repository project management is substantial
- This is related to Issues and Repositories being two of the most extensive features in Forgejo
- Alternative approaches (using dedicated project management tools, or simply ‘shell’ repositories) may be more sustainable
- Clear buy-in is needed for the long term in order to make a change like this viable
2 - Deployment
Platform-level component provisioning via Stacks - Orchestrating the platform infrastructure itself
Overview
Platform Orchestration refers to the automation and management of the platform infrastructure itself. This includes the provisioning, configuration, and lifecycle management of all components that make up the Internal Developer Platform (IDP).
In the context of IPCEI-CIS, Platform Orchestration means:
- Platform Bootstrap: Initial setup of Kubernetes clusters and core services
- Platform Services Management: Deployment and management of ArgoCD, Forgejo, Keycloak, etc.
- Infrastructure-as-Code: Declarative management using Terraform and GitOps
- Multi-Cluster Orchestration: Coordination across different Kubernetes clusters
- Platform Stacks: Reusable bundles of platform components (CNOE concept)
Target Audience
Platform Orchestration is primarily aimed at:
- Platform Engineering Teams: Teams that build and operate the IDP
- Infrastructure Architects: Those responsible for the platform architecture
- SRE Teams: Teams responsible for reliability and operations
Key Features
The entire platform is defined declaratively as code:
- GitOps-First: Everything is versioned in Git and traceable
- Reproducibility: The platform can be rebuilt at any time
- Environment Parity: Consistency between Dev, Test, and Production
- Auditability: Complete history of all changes
Self-Bootstrapping
The platform can bootstrap itself:
- Initial Bootstrap: Minimal tool (like
idpbuilder) starts the platform - Self-Management: After bootstrap, ArgoCD takes over management
- Continuous Reconciliation: Platform is continuously reconciled with Git state
- Self-Healing: Automatic recovery on deviations
Stack-based Composition
Platform components are organized as reusable stacks (CNOE concept):
- Modularity: Components can be updated individually
- Reusability: Stacks can be used across different environments
- Composability: Compose complex platforms from simple building blocks
- Versioning: Stacks can be versioned and tested
In IPCEI-CIS: The stacks concept from CNOE is the core organizational principle for platform components.
Multi-Cluster Support
Platform Orchestration supports different cluster topologies:
- Control Plane + Worker Clusters: Centralized control, distributed workloads
- Hub-and-Spoke: One management cluster manages multiple target clusters
- Federation: Coordination across multiple independent clusters
Purpose in EDP
Platform Orchestration is the foundation of the IPCEI-CIS Edge Developer Platform. It enables:
Foundation for Developer Self-Service
Platform Orchestration ensures all services are available that developers need for self-service:
- GitOps Engine (ArgoCD) for continuous deployment
- Source Control (Forgejo) for code and configuration management
- Identity Management (Keycloak) for authentication and authorization
- Observability (Grafana, Prometheus) for monitoring and logging
- CI/CD (Forgejo Actions/Pipelines) for automated build and test
Consistency Across Environments
Through declarative definition, consistency is guaranteed:
- Development, test, and production environments are identically configured
- No “configuration drift” between environments
- Predictable behavior across all stages
The platform itself is treated like software:
- Version Control: All changes are versioned in Git
- Code Review: Platform changes go through review processes
- Testing: Platform configurations can be tested
- Rollback: Easy rollback on problems
Reduced Operational Overhead
Automation reduces manual effort:
- No manual installation steps
- Automatic updates and patching
- Self-healing on failures
- Standardized deployment processes
Repository
CNOE Reference Implementation: cnoe-io/stacks
CNOE idpbuilder: cnoe-io/idpbuilder
Documentation: CNOE.io Documentation
Getting Started
Prerequisites
- Docker: For local Kubernetes clusters (Kind)
- kubectl: Kubernetes CLI tool
- Git: For repository management
- idpbuilder: CNOE bootstrap tool
Quick Start
Platform Orchestration with CNOE Reference Implementation:
# 1. Install idpbuilder
curl -fsSL https://cnoe.io/install.sh | bash

# 2. Bootstrap platform
idpbuilder create \
  --use-path-routing \
  --package-dir https://github.com/cnoe-io/stacks//ref-implementation

# 3. Wait for platform ready (ca. 10 minutes)
kubectl get applications -A
Verification
Verify the platform is running correctly:
# Get platform secrets (credentials)
idpbuilder get secrets

# Check all ArgoCD applications
kubectl get applications -n argocd

# Expected: All applications "Synced" and "Healthy"
Access URLs (with path-routing):
- ArgoCD:
https://cnoe.localtest.me:8443/argocd - Forgejo:
https://cnoe.localtest.me:8443/gitea - Keycloak:
https://cnoe.localtest.me:8443/keycloak
Usage Examples
Initial bootstrapping of a new platform instance:
idpbuilder create \
  --use-path-routing \
  --package-dir https://github.com/cnoe-io/stacks//ref-implementation \
  --log-level debug

# Workflow:
# 1. Creates Kind cluster
# 2. Installs ingress-nginx
# 3. Clones and installs ArgoCD
# 4. Installs Forgejo
# 5. Waits for core services
# 6. Creates technical users
# 7. Configures Git repositories
# 8. Installs remaining stacks via ArgoCD
After approximately 10 minutes, the platform is fully deployed.
Add new platform components via ArgoCD:
# Create ArgoCD Application for new component
cat <<EOF | kubectl apply -f -
apiVersion: argoproj.io/v1alpha1
kind: Application
metadata:
  name: external-secrets
  namespace: argocd
spec:
  project: default
  source:
    repoURL: https://charts.external-secrets.io
    targetRevision: 0.9.9
    chart: external-secrets
  destination:
    server: https://kubernetes.default.svc
    namespace: external-secrets-system
  syncPolicy:
    automated:
      prune: true
      selfHeal: true
    syncOptions:
      - CreateNamespace=true
EOF
Update platform components:
# 1. Update via Git (GitOps)
cd your-platform-config-repo
git pull

# 2. Update stack version
vim argocd/applications/component.yaml
# Change targetRevision to new version

# 3. Commit and push
git add .
git commit -m "Update component to v1.2.3"
git push

# 4. ArgoCD will automatically sync
# 5. Monitor the update
argocd app sync component --watch
Integration Points
ArgoCD Integration
- Bootstrap: ArgoCD is initially installed via idpbuilder
- Self-Management: After bootstrap, ArgoCD manages itself via Application CRD
- Platform Coordination: ArgoCD orchestrates all other platform components
- Health Monitoring: ArgoCD monitors health status of all platform services
Forgejo Integration
- Source of Truth: Git repositories contain all platform definitions
- GitOps Workflow: Changes in Git trigger platform updates
- Backup: Git serves as backup of platform configuration
- Audit Trail: Git history documents all platform changes
- CI/CD: Forgejo Actions can automate platform operations
- Infrastructure Provisioning: Terraform provisions cloud resources for platform
- State Management: Terraform state tracks infrastructure
- Integration: Terraform can be triggered via Forgejo pipelines
- Multi-Cloud: Support for multiple cloud providers
Architecture
┌─────────────────┐
│   idpbuilder    │  Bootstrap Tool
│  (Initial Run)  │
└────────┬────────┘
         │
         ▼
┌─────────────────────────────────────────────────────┐
│              Kubernetes Cluster                      │
│                                                      │
│  ┌──────────────┐         ┌──────────────┐         │
│  │   ArgoCD     │────────▶│   Forgejo    │         │
│  │  (GitOps)    │         │  (Git Repo)  │         │
│  └──────┬───────┘         └──────────────┘         │
│         │                                            │
│         │  Monitors & Syncs                         │
│         │                                            │
│         ▼                                            │
│  ┌──────────────────────────────────────┐          │
│  │     Platform Stacks                  │          │
│  │                                      │          │
│  │  ┌──────────┐  ┌──────────┐        │          │
│  │  │Forgejo   │  │Keycloak  │        │          │
│  │  └──────────┘  └──────────┘        │          │
│  │  ┌──────────┐  ┌──────────┐        │          │
│  │  │Observ-   │  │Ingress   │        │          │
│  │  │ability   │  │          │        │          │
│  │  └──────────┘  └──────────┘        │          │
│  └──────────────────────────────────────┘          │
└─────────────────────────────────────────────────────┘
The idpbuilder executes the following workflow:
- Create Kind Kubernetes cluster
- Install ingress-nginx controller
- Install ArgoCD
- Install Forgejo Git server
- Wait for services to be ready
- Create technical users in Forgejo
- Create repository for platform state in Forgejo
- Push platform stacks to Forgejo
- Create ArgoCD Applications for all stacks
- ArgoCD takes over continuous synchronization
Deployment Architecture
The platform is deployed in different namespaces:
argocd: ArgoCD and its componentsgitea: Forgejo Git serverkeycloak: Identity and access managementobservability: Prometheus, Grafana, etc.ingress-nginx: Ingress controller
Configuration
idpbuilder Configuration
Key configuration options for idpbuilder:
# Path-based routing (recommended for local development)
idpbuilder create --use-path-routing

# Custom package directory
idpbuilder create --package-dir /path/to/custom/packages

# Custom Kind cluster config
idpbuilder create --kind-config custom-kind.yaml

# Enable debug logging
idpbuilder create --log-level debug
ArgoCD Configuration
Important ArgoCD configurations for platform orchestration:
# argocd-cm ConfigMap
data:
  # Enable automatic sync
  application.instanceLabelKey: argocd.argoproj.io/instance

  # Repository credentials
  repositories: |
    - url: https://github.com/cnoe-io/stacks
      name: cnoe-stacks
      type: git

  # Resource exclusions
  resource.exclusions: |
    - apiGroups:
      - cilium.io
      kinds:
      - CiliumIdentity
Configuration of platform stacks via Kustomize:
# kustomization.yaml
apiVersion: kustomize.config.k8s.io/v1beta1
kind: Kustomization

namespace: platform-system

resources:
  - argocd-app.yaml
  - forgejo-app.yaml
  - keycloak-app.yaml

patches:
  - target:
      kind: Application
    patch: |-
      - op: add
        path: /spec/syncPolicy
        value:
          automated:
            prune: true
            selfHeal: true
Troubleshooting
Problem: After idpbuilder create, platform services are not reachable
Solution:
# 1. Check if all pods are running
kubectl get pods -A

# 2. Check ArgoCD application status
kubectl get applications -n argocd

# 3. Check ingress
kubectl get ingress -A

# 4. Verify DNS resolution
nslookup cnoe.localtest.me

# 5. Check idpbuilder logs
idpbuilder get logs
ArgoCD Applications not synchronized
Problem: ArgoCD Applications show status “OutOfSync”
Solution:
# 1. Check application details
argocd app get <app-name>

# 2. View sync status
argocd app sync <app-name> --dry-run

# 3. Force sync
argocd app sync <app-name> --force

# 4. Check for errors in ArgoCD logs
kubectl logs -n argocd deployment/argocd-application-controller
Git Repository Connection Issues
Problem: ArgoCD cannot access Git repository
Solution:
# 1. Verify repository configuration
argocd repo list

# 2. Test connection
argocd repo get https://your-git-repo

# 3. Check credentials
kubectl get secret -n argocd

# 4. Re-add repository with correct credentials
argocd repo add https://your-git-repo \
  --username <user> \
  --password <token>
Based on experience and CNCF Guidelines:
- Start Simple: Begin with the CNOE reference stack, extend gradually
- Automate Everything: Manual platform changes are anti-pattern
- Monitor Continuously: Use observability tools for platform health
- Document Well: Platform documentation is essential for adoption
- Version Everything: All platform components should be versioned
- Test Changes: Platform updates should be tested in non-prod
- Plan for Disaster: Backup and disaster recovery strategies are important
- Use Stacks: Organize platform components as reusable stacks
Status
Maturity: Production (for CNOE Reference Implementation)
Stability: Stable
Support: Community Support via CNOE Community
Additional Resources
CNOE Resources
GitOps
CNOE Stacks
2.1 - Basic Concepts
Platform-level component provisioning via Stacks - Orchestrating the platform infrastructure itself
Overview
Platform Orchestration refers to the automation and management of the platform infrastructure itself. This includes the provisioning, configuration, and lifecycle management of all components that make up the Internal Developer Platform (IDP).
In the context of IPCEI-CIS, Platform Orchestration means:
- Platform Bootstrap: Initial setup of Kubernetes clusters and core services
- Platform Services Management: Deployment and management of ArgoCD, Forgejo, Keycloak, etc.
- Infrastructure-as-Code: Declarative management using Terraform and GitOps
- Multi-Cluster Orchestration: Coordination across different Kubernetes clusters
- Platform Stacks: Reusable bundles of platform components (CNOE concept)
Target Audience
Platform Orchestration is primarily aimed at:
- Platform Engineering Teams: Teams that build and operate the IDP
- Infrastructure Architects: Those responsible for the platform architecture
- SRE Teams: Teams responsible for reliability and operations
Key Features
The entire platform is defined declaratively as code:
- GitOps-First: Everything is versioned in Git and traceable
- Reproducibility: The platform can be rebuilt at any time
- Environment Parity: Consistency between Dev, Test, and Production
- Auditability: Complete history of all changes
Self-Bootstrapping
The platform can bootstrap itself:
- Initial Bootstrap: Minimal tool (like
idpbuilder) starts the platform - Self-Management: After bootstrap, ArgoCD takes over management
- Continuous Reconciliation: Platform is continuously reconciled with Git state
- Self-Healing: Automatic recovery on deviations
Stack-based Composition
Platform components are organized as reusable stacks (CNOE concept):
- Modularity: Components can be updated individually
- Reusability: Stacks can be used across different environments
- Composability: Compose complex platforms from simple building blocks
- Versioning: Stacks can be versioned and tested
In IPCEI-CIS: The stacks concept from CNOE is the core organizational principle for platform components.
Multi-Cluster Support
Platform Orchestration supports different cluster topologies:
- Control Plane + Worker Clusters: Centralized control, distributed workloads
- Hub-and-Spoke: One management cluster manages multiple target clusters
- Federation: Coordination across multiple independent clusters
Purpose in EDP
Platform Orchestration is the foundation of the IPCEI-CIS Edge Developer Platform. It enables:
Foundation for Developer Self-Service
Platform Orchestration ensures all services are available that developers need for self-service:
- GitOps Engine (ArgoCD) for continuous deployment
- Source Control (Forgejo) for code and configuration management
- Identity Management (Keycloak) for authentication and authorization
- Observability (Grafana, Prometheus) for monitoring and logging
- CI/CD (Forgejo Actions/Pipelines) for automated build and test
Consistency Across Environments
Through declarative definition, consistency is guaranteed:
- Development, test, and production environments are identically configured
- No “configuration drift” between environments
- Predictable behavior across all stages
The platform itself is treated like software:
- Version Control: All changes are versioned in Git
- Code Review: Platform changes go through review processes
- Testing: Platform configurations can be tested
- Rollback: Easy rollback on problems
Reduced Operational Overhead
Automation reduces manual effort:
- No manual installation steps
- Automatic updates and patching
- Self-healing on failures
- Standardized deployment processes
Repository
CNOE Reference Implementation: cnoe-io/stacks
CNOE idpbuilder: cnoe-io/idpbuilder
Documentation: CNOE.io Documentation
Getting Started
Prerequisites
- Docker: For local Kubernetes clusters (Kind)
- kubectl: Kubernetes CLI tool
- Git: For repository management
- idpbuilder: CNOE bootstrap tool
Quick Start
Platform Orchestration with CNOE Reference Implementation:
# 1. Install idpbuilder
curl -fsSL https://cnoe.io/install.sh | bash

# 2. Bootstrap platform
idpbuilder create \
  --use-path-routing \
  --package-dir https://github.com/cnoe-io/stacks//ref-implementation

# 3. Wait for platform ready (ca. 10 minutes)
kubectl get applications -A
Verification
Verify the platform is running correctly:
# Get platform secrets (credentials)
idpbuilder get secrets

# Check all ArgoCD applications
kubectl get applications -n argocd

# Expected: All applications "Synced" and "Healthy"
Access URLs (with path-routing):
- ArgoCD:
https://cnoe.localtest.me:8443/argocd - Forgejo:
https://cnoe.localtest.me:8443/gitea - Keycloak:
https://cnoe.localtest.me:8443/keycloak
Usage Examples
Initial bootstrapping of a new platform instance:
idpbuilder create \
  --use-path-routing \
  --package-dir https://github.com/cnoe-io/stacks//ref-implementation \
  --log-level debug

# Workflow:
# 1. Creates Kind cluster
# 2. Installs ingress-nginx
# 3. Clones and installs ArgoCD
# 4. Installs Forgejo
# 5. Waits for core services
# 6. Creates technical users
# 7. Configures Git repositories
# 8. Installs remaining stacks via ArgoCD
After approximately 10 minutes, the platform is fully deployed.
Add new platform components via ArgoCD:
# Create ArgoCD Application for new component
cat <<EOF | kubectl apply -f -
apiVersion: argoproj.io/v1alpha1
kind: Application
metadata:
  name: external-secrets
  namespace: argocd
spec:
  project: default
  source:
    repoURL: https://charts.external-secrets.io
    targetRevision: 0.9.9
    chart: external-secrets
  destination:
    server: https://kubernetes.default.svc
    namespace: external-secrets-system
  syncPolicy:
    automated:
      prune: true
      selfHeal: true
    syncOptions:
      - CreateNamespace=true
EOF
Update platform components:
# 1. Update via Git (GitOps)
cd your-platform-config-repo
git pull

# 2. Update stack version
vim argocd/applications/component.yaml
# Change targetRevision to new version

# 3. Commit and push
git add .
git commit -m "Update component to v1.2.3"
git push

# 4. ArgoCD will automatically sync
# 5. Monitor the update
argocd app sync component --watch
Integration Points
ArgoCD Integration
- Bootstrap: ArgoCD is initially installed via idpbuilder
- Self-Management: After bootstrap, ArgoCD manages itself via Application CRD
- Platform Coordination: ArgoCD orchestrates all other platform components
- Health Monitoring: ArgoCD monitors health status of all platform services
Forgejo Integration
- Source of Truth: Git repositories contain all platform definitions
- GitOps Workflow: Changes in Git trigger platform updates
- Backup: Git serves as backup of platform configuration
- Audit Trail: Git history documents all platform changes
- CI/CD: Forgejo Actions can automate platform operations
- Infrastructure Provisioning: Terraform provisions cloud resources for platform
- State Management: Terraform state tracks infrastructure
- Integration: Terraform can be triggered via Forgejo pipelines
- Multi-Cloud: Support for multiple cloud providers
Architecture
Loading architecture diagram...
The idpbuilder executes the following workflow:
- Create Kind Kubernetes cluster
- Install ingress-nginx controller
- Install ArgoCD
- Install Forgejo Git server
- Wait for services to be ready
- Create technical users in Forgejo
- Create repository for platform state in Forgejo
- Push platform stacks to Forgejo
- Create ArgoCD Applications for all stacks
- ArgoCD takes over continuous synchronization
Deployment Architecture
The platform is deployed in different namespaces:
argocd: ArgoCD and its componentsgitea: Forgejo Git serverkeycloak: Identity and access managementobservability: Prometheus, Grafana, etc.ingress-nginx: Ingress controller
Configuration
idpbuilder Configuration
Key configuration options for idpbuilder:
# Path-based routing (recommended for local development)
idpbuilder create --use-path-routing

# Custom package directory
idpbuilder create --package-dir /path/to/custom/packages

# Custom Kind cluster config
idpbuilder create --kind-config custom-kind.yaml

# Enable debug logging
idpbuilder create --log-level debug
ArgoCD Configuration
Important ArgoCD configurations for platform orchestration:
# argocd-cm ConfigMap
data:
  # Enable automatic sync
  application.instanceLabelKey: argocd.argoproj.io/instance

  # Repository credentials
  repositories: |
    - url: https://github.com/cnoe-io/stacks
      name: cnoe-stacks
      type: git

  # Resource exclusions
  resource.exclusions: |
    - apiGroups:
      - cilium.io
      kinds:
      - CiliumIdentity
Configuration of platform stacks via Kustomize:
# kustomization.yaml
apiVersion: kustomize.config.k8s.io/v1beta1
kind: Kustomization

namespace: platform-system

resources:
  - argocd-app.yaml
  - forgejo-app.yaml
  - keycloak-app.yaml

patches:
  - target:
      kind: Application
    patch: |-
      - op: add
        path: /spec/syncPolicy
        value:
          automated:
            prune: true
            selfHeal: true
Troubleshooting
Problem: After idpbuilder create, platform services are not reachable
Solution:
# 1. Check if all pods are running
kubectl get pods -A

# 2. Check ArgoCD application status
kubectl get applications -n argocd

# 3. Check ingress
kubectl get ingress -A

# 4. Verify DNS resolution
nslookup cnoe.localtest.me

# 5. Check idpbuilder logs
idpbuilder get logs
ArgoCD Applications not synchronized
Problem: ArgoCD Applications show status “OutOfSync”
Solution:
# 1. Check application details
argocd app get <app-name>

# 2. View sync status
argocd app sync <app-name> --dry-run

# 3. Force sync
argocd app sync <app-name> --force

# 4. Check for errors in ArgoCD logs
kubectl logs -n argocd deployment/argocd-application-controller
Git Repository Connection Issues
Problem: ArgoCD cannot access Git repository
Solution:
# 1. Verify repository configuration
argocd repo list

# 2. Test connection
argocd repo get https://your-git-repo

# 3. Check credentials
kubectl get secret -n argocd

# 4. Re-add repository with correct credentials
argocd repo add https://your-git-repo \
  --username <user> \
  --password <token>
Based on experience and CNCF Guidelines:
- Start Simple: Begin with the CNOE reference stack, extend gradually
- Automate Everything: Manual platform changes are anti-pattern
- Monitor Continuously: Use observability tools for platform health
- Document Well: Platform documentation is essential for adoption
- Version Everything: All platform components should be versioned
- Test Changes: Platform updates should be tested in non-prod
- Plan for Disaster: Backup and disaster recovery strategies are important
- Use Stacks: Organize platform components as reusable stacks
Status
Maturity: Production (for CNOE Reference Implementation)
Stability: Stable
Support: Community Support via CNOE Community
Additional Resources
CNOE Resources
GitOps
CNOE Stacks
2.1.1 - Platform Orchestration
Orchestration in the context of Platform Engineering - coordinating infrastructure, platform, and application delivery.
Overview
Orchestration in the context of Platform Engineering refers to the coordinated automation and management of infrastructure, platform, and application components throughout their entire lifecycle. It is a fundamental concept that bridges the gap between declarative specifications (what should be deployed) and actual execution (how it is deployed).
Platform Engineering has emerged as a discipline to improve developer experience and reduce cognitive load on development teams (CNCF Platforms White Paper). Orchestration is the central mechanism that enables this vision:
- Automation of Complex Workflows: Orchestration coordinates multiple steps and dependencies automatically
- Consistency and Reproducibility: Guaranteed, repeatable deployments across different environments
- Self-Service Capabilities: Developers can independently orchestrate resources and deployments
- Governance and Compliance: Centralized control over policies and best practices
What Does Orchestration Do?
Orchestration systems perform the following tasks:
- Workflow Coordination: Coordination of complex, multi-step deployment processes
- Dependency Management: Resolution and management of dependencies between components
- State Management: Continuous monitoring and reconciliation between desired and actual state
- Resource Provisioning: Automatic provisioning of infrastructure and services
- Configuration Management: Management of configurations across different environments
- Health Monitoring: Monitoring the health of deployed resources
Three Layers of Orchestration
In modern Platform Engineering, we distinguish three fundamental layers of orchestration:
Infrastructure Orchestration deals with the lowest level - the physical and virtual infrastructure layer. This includes:
- Provisioning of compute, network, and storage resources
- Cloud resource management (VMs, networking, storage)
- Infrastructure-as-Code deployment (Terraform, etc.)
- Bare metal and hypervisor management
Target Audience: Infrastructure Engineers, Cloud Architects
Note: Detailed documentation for Infrastructure Orchestration is maintained separately.
More details: Infrastructure Orchestration →
Platform Orchestration focuses on deploying and managing the platform itself - the services and tools that development teams use. This includes:
- Installation and configuration of Kubernetes clusters
- Deployment of platform services (GitOps tools, Observability, Security)
- Management of platform components via Stacks
- Multi-cluster orchestration
Target Audience: Platform Engineering Teams, SRE Teams
In IPCEI-CIS: Platform orchestration is realized using the CNOE stack concept with ArgoCD and Forgejo.
More details: Platform Orchestration →
Application Orchestration concentrates on the deployment and lifecycle management of applications running on the platform. This includes:
- Deployment of microservices and containerized applications
- CI/CD pipeline orchestration
- Configuration management and secrets handling
- Application health monitoring and auto-scaling
Target Audience: Application Developers, DevOps Engineers
In IPCEI-CIS: Application orchestration uses Forgejo pipelines for CI/CD and ArgoCD for GitOps-based deployment.
More details: Application Orchestration →
GitOps as Orchestration Paradigm
A central approach in modern platform orchestration solutions is GitOps. GitOps uses Git repositories as the single source of truth for declarative infrastructure and applications:
- Declarative Approach: The desired state is defined in Git
- Automatic Synchronization: Controllers monitor Git and reconcile the live state
- Audit Trail: All changes are traceable in Git history
- Rollback Capability: Easy rollback through Git revert
Continuous Reconciliation
An important concept is continuous reconciliation:
- The orchestrator monitors both the source (Git) and the target (e.g., Kubernetes cluster)
- Deviations trigger automatic corrective actions
- Health checks validate that the desired state has been achieved
- Drift detection warns of unexpected changes
Within the IPCEI-CIS platform, we utilize the CNOE (Cloud Native Operational Excellence) stack concept with the following orchestration components:
ArgoCD
- Continuous Delivery for Kubernetes based on GitOps
- Synchronizes Kubernetes manifests from Git repositories
- Supports Helm Charts, Kustomize, Jsonnet, and plain YAML
- Multi-cluster deployment capabilities
- Application Sets for parameterized deployments
Role in IPCEI-CIS: ArgoCD is the central component for GitOps-based deployment management. After the initial bootstrapping phase, ArgoCD takes over the technical coordination of all components.
Forgejo
- Git Repository Management and source control
- CI/CD Pipelines via Forgejo Actions (GitHub Actions compatible)
- Developer Portal Capabilities (initially planned, project discontinued)
- Package registry and artifact management
- Integration with ArgoCD for GitOps workflows
Role in IPCEI-CIS: Forgejo serves as the Git repository host and CI/CD engine. It was initially planned as a developer portal (similar to Backstage’s role in other stacks) but this aspect was not fully realized before project completion.
Note on Backstage: In typical CNOE implementations, Backstage serves as the developer portal providing golden paths through software templates. IPCEI-CIS initially planned to use Forgejo for this purpose but the project concluded before full implementation.
- Infrastructure-as-Code provisioning
- Multi-cloud resource management
- State management for infrastructure
- Integration with Forgejo pipelines for automated deployment
Role in IPCEI-CIS: Terraform handles infrastructure provisioning at the infrastructure orchestration layer, integrated into automated workflows via Forgejo pipelines.
CNOE Stacks Concept
- Modular Platform Components bundled as stacks
- Reusable, composable platform building blocks
- Version-controlled stack definitions
- GitOps-based stack deployment via ArgoCD
Role in IPCEI-CIS: The stacks concept from CNOE provides the structural foundation for platform orchestration, enabling modular deployment and management of platform components.
The Orchestration Workflow
A typical orchestration workflow in the IPCEI-CIS platform:
Loading architecture diagram...
Workflow Steps:
- Definition: Developer defines application/infrastructure as code
- Commit: Changes are committed to Forgejo Git repository
- CI Pipeline: Forgejo Actions build, test, and package the application
- Sync: ArgoCD detects changes and triggers deployment
- Provision: Terraform orchestrates required cloud resources (if needed)
- Deploy: Application is deployed to Kubernetes
- Monitor: Continuous monitoring and health checks
- Reconcile: Automatic correction on drift detection
Benefits of Coordinated Orchestration
The integration of infrastructure, platform, and application orchestration provides crucial advantages:
- Reduced Complexity: Developers don’t need to know all infrastructure details
- Faster Time-to-Market: Automated workflows accelerate deployments
- Consistency: Standardized patterns across all teams
- Governance: Central policies are automatically enforced
- Scalability: Platform teams can support many application teams
- Self-Service: Developers can provision services independently
- Audit and Compliance: Complete traceability through Git history
Best Practices
Successful orchestration follows proven principles (Platform Engineering Principles):
- Platform as a Product: Treat the platform as a product with focus on user experience
- Self-Service First: Enable developers to use services autonomously
- Documentation: Comprehensive documentation of golden paths
- Feedback Loops: Continuous improvement through user feedback
- Thin Platform Layer: Use managed services where possible instead of building everything
- Progressive Disclosure: Offer different abstraction levels
- Focus on Common Problems: Solve recurring problems centrally
- Treat Glue as Valuable: Integration of different tools is valuable
- Clear Mission: Define clear goals and responsibilities
Avoiding Anti-Patterns
Common mistakes in platform orchestration (How to fail at Platform Engineering):
- Product Misfit: Building platform without involving developers
- Overly Complex Design: Too many features and unnecessary complexity
- Swiss Knife Syndrome: Trying to solve all problems with one tool
- Insufficient Documentation: Missing or outdated documentation
- Siloed Development: Platform and development teams working in isolation
- Stagnant Platform: Platform not continuously evolved
Sub-Components
The orchestration component includes the following sub-areas:
Further Resources
Fundamentals
GitOps
- CNOE.io - Cloud Native Operational Excellence Framework
- Forgejo - Self-hosted Git service with CI/CD
- Terraform - Infrastructure as Code tool
2.1.2 - Application Orchestration
Application deployment via CI/CD pipelines and GitOps - Orchestrating application deployments
Overview
Application Orchestration deals with the automation of application deployment and lifecycle management. It encompasses the entire workflow from source code to running application in production.
In the context of IPCEI-CIS, Application Orchestration includes:
- CI/CD Pipelines: Automated build, test, and deployment pipelines
- GitOps Deployment: Declarative application deployment via ArgoCD
- Progressive Delivery: Canary deployments, blue-green deployments
- Application Configuration: Environment-specific configuration management
- Golden Paths: Standardized deployment templates and workflows
Target Audience
Application Orchestration is primarily for:
- Application Developers: Teams developing and deploying applications
- DevOps Teams: Teams responsible for deployment automation
- Product Teams: Teams responsible for application lifecycle
Key Features
Automated CI/CD Pipelines
Forgejo Actions provides GitHub Actions-compatible CI/CD:
- Build Automation: Automatic building of container images
- Test Automation: Automated unit, integration, and E2E tests
- Security Scanning: Vulnerability scanning of dependencies and images
- Artifact Publishing: Publishing to container registries
- Deployment Triggering: Automatic deployment after successful build
GitOps-based Deployment
ArgoCD enables declarative application deployment:
- Declarative Configuration: Applications defined as Kubernetes manifests
- Automated Sync: Automatic synchronization between Git and cluster
- Rollback Capability: Easy rollback to previous versions
- Multi-Environment: Consistent deployment across Dev/Test/Prod
- Health Monitoring: Continuous monitoring of application health
Progressive Delivery
Support for advanced deployment strategies:
- Canary Deployments: Gradual rollout to subset of users
- Blue-Green Deployments: Zero-downtime deployments with instant rollback
- A/B Testing: Traffic splitting for feature testing
- Feature Flags: Dynamic feature enablement without deployment
Configuration Management
Flexible configuration for different environments:
- Environment Variables: Configuration via environment variables
- ConfigMaps: Kubernetes-native configuration
- Secrets Management: Secure handling of sensitive data
- External Secrets: Integration with external secret stores (Vault, etc.)
Purpose in EDP
Application Orchestration is the core of developer experience in IPCEI-CIS Edge Developer Platform.
Developer Self-Service
Developers can deploy applications independently:
- Self-Service Deployment: No dependency on operations team
- Standardized Workflows: Clear, documented deployment processes
- Fast Feedback: Quick feedback through automated pipelines
- Environment Parity: Consistent behavior across all environments
Quality and Security
Automated checks ensure quality and security:
- Automated Testing: All changes are automatically tested
- Security Scans: Vulnerability scanning of dependencies and images
- Policy Enforcement: Automated policy checks (OPA, Kyverno)
- Compliance: Auditability of all deployments
Efficiency and Productivity
Automation increases team efficiency:
- Faster Time-to-Market: Faster deployment of new features
- Reduced Manual Work: Automation of repetitive tasks
- Fewer Errors: Fewer manual mistakes through automation
- Better Collaboration: Clear interfaces between Dev and Ops
Repository
Forgejo: forgejo.org
Forgejo Actions: Forgejo Actions Documentation
ArgoCD: argoproj.github.io/cd
Getting Started
Prerequisites
- Forgejo Account: Access to Forgejo instance
- Kubernetes Cluster: Target cluster for deployments
- ArgoCD Access: Access to ArgoCD instance
- Git: For repository management
Quick Start: Application Deployment
- Create Application Repository
# Create new repository in Forgejo
git init my-application
cd my-application

# Add application code and Dockerfile
cat > Dockerfile <<EOF
FROM node:18-alpine
WORKDIR /app
COPY package*.json ./
RUN npm ci --only=production
COPY . .
EXPOSE 3000
CMD ["node", "server.js"]
EOF
- Add CI/CD Pipeline
Create .forgejo/workflows/build.yaml:
name: Build and Push

on:
  push:
    branches: [ main ]
  pull_request:
    branches: [ main ]

jobs:
  build:
    runs-on: ubuntu-latest
    steps:
      - uses: actions/checkout@v3

      - name: Set up Docker Buildx
        uses: docker/setup-buildx-action@v2

      - name: Login to Registry
        uses: docker/login-action@v2
        with:
          registry: registry.example.com
          username: ${{ secrets.REGISTRY_USER }}
          password: ${{ secrets.REGISTRY_PASSWORD }}

      - name: Build and push
        uses: docker/build-push-action@v4
        with:
          context: .
          push: ${{ github.event_name == 'push' }}
          tags: registry.example.com/my-app:${{ github.sha }}
- Create Kubernetes Manifests
Create k8s/deployment.yaml:
apiVersion: apps/v1
kind: Deployment
metadata:
  name: my-application
spec:
  replicas: 3
  selector:
    matchLabels:
      app: my-application
  template:
    metadata:
      labels:
        app: my-application
    spec:
      containers:
      - name: app
        image: registry.example.com/my-app:latest
        ports:
        - containerPort: 3000
        env:
        - name: NODE_ENV
          value: "production"
---
apiVersion: v1
kind: Service
metadata:
  name: my-application
spec:
  selector:
    app: my-application
  ports:
  - port: 80
    targetPort: 3000
- Configure ArgoCD Application
apiVersion: argoproj.io/v1alpha1
kind: Application
metadata:
  name: my-application
  namespace: argocd
spec:
  project: default
  source:
    repoURL: https://forgejo.example.com/myteam/my-application
    targetRevision: main
    path: k8s
  destination:
    server: https://kubernetes.default.svc
    namespace: production
  syncPolicy:
    automated:
      prune: true
      selfHeal: true
- Deploy
# Commit and push
git add .
git commit -m "Add application and deployment configuration"
git push origin main

# ArgoCD will automatically deploy the application
argocd app sync my-application --watch
Usage Examples
Use Case 1: Multi-Environment Deployment
Deploy application to multiple environments:
Repository Structure:
my-application/
├── .forgejo/
│   └── workflows/
│       └── build.yaml
├── base/
│   ├── deployment.yaml
│   ├── service.yaml
│   └── kustomization.yaml
├── overlays/
│   ├── dev/
│   │   ├── kustomization.yaml
│   │   └── patches.yaml
│   ├── staging/
│   │   ├── kustomization.yaml
│   │   └── patches.yaml
│   └── production/
│       ├── kustomization.yaml
│       └── patches.yaml
Kustomize Base (base/kustomization.yaml):
apiVersion: kustomize.config.k8s.io/v1beta1
kind: Kustomization

resources:
  - deployment.yaml
  - service.yaml

commonLabels:
  app: my-application
Environment Overlay (overlays/production/kustomization.yaml):
apiVersion: kustomize.config.k8s.io/v1beta1
kind: Kustomization

bases:
  - ../../base

namespace: production

replicas:
  - name: my-application
    count: 5

images:
  - name: my-app
    newTag: v1.2.3

patches:
  - patches.yaml
ArgoCD Applications for each environment:
apiVersion: argoproj.io/v1alpha1
kind: Application
metadata:
  name: my-application-prod
  namespace: argocd
spec:
  project: default
  source:
    repoURL: https://forgejo.example.com/myteam/my-application
    targetRevision: main
    path: overlays/production
  destination:
    server: https://kubernetes.default.svc
    namespace: production
  syncPolicy:
    automated:
      prune: true
      selfHeal: true
Use Case 2: Canary Deployment
Progressive rollout with canary strategy:
Argo Rollouts Canary:
apiVersion: argoproj.io/v1alpha1
kind: Rollout
metadata:
  name: my-application
spec:
  replicas: 10
  strategy:
    canary:
      steps:
      - setWeight: 10
      - pause: {duration: 5m}
      - setWeight: 30
      - pause: {duration: 5m}
      - setWeight: 60
      - pause: {duration: 5m}
      - setWeight: 100
  selector:
    matchLabels:
      app: my-application
  template:
    metadata:
      labels:
        app: my-application
    spec:
      containers:
      - name: app
        image: registry.example.com/my-app:v2.0.0
Use Case 3: Feature Flags
Dynamic feature control without deployment:
Application Code with Feature Flag:
const Unleash = require('unleash-client');

const unleash = new Unleash({
  url: 'http://unleash.platform/api/',
  appName: 'my-application',
  customHeaders: {
    Authorization: process.env.UNLEASH_API_TOKEN
  }
});

// Use feature flag
if (unleash.isEnabled('new-checkout-flow')) {
  // New checkout implementation
  renderNewCheckout();
} else {
  // Old checkout implementation
  renderOldCheckout();
}
Integration Points
Forgejo Integration
Forgejo serves as central source code management and CI/CD platform:
- Source Control: Git repositories for application code
- CI/CD Pipelines: Forgejo Actions for automated builds and tests
- Container Registry: Built-in container registry for images
- Webhook Integration: Triggers for external systems
- Pull Request Workflows: Code review and approval processes
ArgoCD Integration
ArgoCD handles declarative application deployment:
- GitOps Sync: Continuous synchronization with Git state
- Health Monitoring: Application health status monitoring
- Rollback Support: Easy rollback to previous versions
- Multi-Cluster: Deployment to multiple clusters
- UI and CLI: Web interface and command-line access
Observability Integration
Integration with monitoring and logging:
- Metrics: Prometheus metrics from applications
- Logs: Centralized log collection via Loki/ELK
- Tracing: Distributed tracing with Jaeger/Tempo
- Alerting: Alert rules for application issues
Architecture
Application Deployment Flow
Loading architecture diagram...
CI/CD Pipeline Architecture
Typical Forgejo Actions pipeline stages:
- Checkout: Clone source code
- Build: Compile application and dependencies
- Test: Run unit and integration tests
- Security Scan: Scan dependencies and code for vulnerabilities
- Build Image: Create container image
- Push Image: Push to container registry
- Update Manifests: Update Kubernetes manifests with new image tag
- Notify: Send notifications on success/failure
Configuration
Forgejo Actions Configuration
Example for Node.js application:
name: CI/CD Pipeline

on:
  push:
    branches: [ main, develop ]
  pull_request:
    branches: [ main ]

env:
  REGISTRY: registry.example.com
  IMAGE_NAME: ${{ github.repository }}

jobs:
  test:
    runs-on: ubuntu-latest
    steps:
      - uses: actions/checkout@v3

      - name: Setup Node.js
        uses: actions/setup-node@v3
        with:
          node-version: '18'
          cache: 'npm'

      - name: Install dependencies
        run: npm ci

      - name: Run tests
        run: npm test

      - name: Run linter
        run: npm run lint

  security:
    runs-on: ubuntu-latest
    steps:
      - uses: actions/checkout@v3

      - name: Run Trivy vulnerability scanner
        uses: aquasecurity/trivy-action@master
        with:
          scan-type: 'fs'
          scan-ref: '.'
          format: 'sarif'
          output: 'trivy-results.sarif'

  build-and-push:
    needs: [test, security]
    runs-on: ubuntu-latest
    if: github.event_name == 'push'
    steps:
      - uses: actions/checkout@v3

      - name: Set up Docker Buildx
        uses: docker/setup-buildx-action@v2

      - name: Login to Registry
        uses: docker/login-action@v2
        with:
          registry: ${{ env.REGISTRY }}
          username: ${{ secrets.REGISTRY_USER }}
          password: ${{ secrets.REGISTRY_PASSWORD }}

      - name: Extract metadata
        id: meta
        uses: docker/metadata-action@v4
        with:
          images: ${{ env.REGISTRY }}/${{ env.IMAGE_NAME }}
          tags: |
            type=ref,event=branch
            type=sha,prefix={{branch}}-

      - name: Build and push
        uses: docker/build-push-action@v4
        with:
          context: .
          push: true
          tags: ${{ steps.meta.outputs.tags }}
          cache-from: type=gha
          cache-to: type=gha,mode=max
ArgoCD Application Configuration
Complete configuration example:
apiVersion: argoproj.io/v1alpha1
kind: Application
metadata:
  name: my-application
  namespace: argocd
  finalizers:
    - resources-finalizer.argocd.argoproj.io
spec:
  project: default

  source:
    repoURL: https://forgejo.example.com/myteam/my-application
    targetRevision: main
    path: k8s/overlays/production

    # Kustomize options
    kustomize:
      version: v5.0.0
      images:
        - my-app=registry.example.com/my-app:v1.2.3

  destination:
    server: https://kubernetes.default.svc
    namespace: production

  # Sync policy
  syncPolicy:
    automated:
      prune: true        # Delete resources not in Git
      selfHeal: true     # Override manual changes
      allowEmpty: false  # Don't delete everything on empty repo

    syncOptions:
      - CreateNamespace=true
      - PruneLast=true
      - RespectIgnoreDifferences=true

    retry:
      limit: 5
      backoff:
        duration: 5s
        factor: 2
        maxDuration: 3m

  # Ignore differences (avoid sync loops)
  ignoreDifferences:
    - group: apps
      kind: Deployment
      jsonPointers:
        - /spec/replicas  # Ignore if HPA manages replicas
Troubleshooting
Pipeline Fails
Problem: Forgejo Actions pipeline fails
Solution:
# 1. Check pipeline logs in Forgejo UI
# Navigate to: Repository → Actions → Select failed run

# 2. Check runner status
# In Forgejo: Site Admin → Actions → Runners

# 3. Check runner logs
kubectl logs -n forgejo-runner deployment/act-runner

# 4. Test pipeline locally with act
act -l  # List available jobs
act -j build  # Run specific job
ArgoCD Application OutOfSync
Problem: Application shows “OutOfSync” status
Solution:
# 1. Check differences
argocd app diff my-application

# 2. View sync status details
argocd app get my-application

# 3. Manual sync
argocd app sync my-application

# 4. Hard refresh (ignore cache)
argocd app sync my-application --force

# 5. Check for ignored differences
argocd app get my-application --show-operation
Application Deployment Fails
Problem: Application pod crashes after deployment
Solution:
# 1. Check pod status
kubectl get pods -n production

# 2. View pod logs
kubectl logs -n production deployment/my-application

# 3. Describe pod for events
kubectl describe pod -n production <pod-name>

# 4. Check resource limits
kubectl top pod -n production

# 5. Rollback via ArgoCD
argocd app rollback my-application
Image Pull Errors
Problem: Kubernetes cannot pull container image
Solution:
# 1. Verify image exists
docker pull registry.example.com/my-app:v1.2.3

# 2. Check image pull secret
kubectl get secret -n production regcred

# 3. Create image pull secret if missing
kubectl create secret docker-registry regcred \
  --docker-server=registry.example.com \
  --docker-username=user \
  --docker-password=password \
  -n production

# 4. Reference secret in deployment
kubectl patch deployment my-application -n production \
  -p '{"spec":{"template":{"spec":{"imagePullSecrets":[{"name":"regcred"}]}}}}'
Best Practices
Golden Path Templates
Provide standardized templates for common use cases:
- Web Application Template: Node.js, Python, Go web services
- API Service Template: RESTful API with OpenAPI
- Batch Job Template: Kubernetes CronJob configurations
- Microservice Template: Service mesh integration
Example repository template structure:
application-template/
├── .forgejo/
│   └── workflows/
│       ├── build.yaml
│       ├── test.yaml
│       └── deploy.yaml
├── k8s/
│   ├── base/
│   └── overlays/
├── src/
│   └── ...
├── Dockerfile
├── README.md
└── .gitignore
Deployment Checklist
Before deploying to production:
- ✅ All tests passing
- ✅ Security scans completed
- ✅ Resource limits defined
- ✅ Health checks configured
- ✅ Monitoring and alerts set up
- ✅ Backup strategy defined
- ✅ Rollback plan documented
- ✅ Team notified about deployment
Configuration Management
- Use ConfigMaps for non-sensitive configuration
- Use Secrets for sensitive data
- Use External Secrets Operator for vault integration
- Never commit secrets to Git
- Use environment-specific overlays (Kustomize)
- Document all configuration options
Status
Maturity: Production
Stability: Stable
Support: Internal Platform Team
Additional Resources
Forgejo
ArgoCD
GitOps
CI/CD
2.2 - Infrastructure as Code
Managing infrastructure through machine-readable definition files rather than manual configuration
Overview
Infrastructure as Code (IaC) is the practice of managing and provisioning infrastructure through code rather than manual processes. Instead of clicking through web consoles or running one-off commands, infrastructure is defined in version-controlled files that can be executed repeatedly to produce identical environments.
This approach treats infrastructure with the same rigor as application code: it’s versioned, reviewed, tested, and deployed through automated pipelines.
Why Infrastructure as Code?
The problem with manual infrastructure
Traditional infrastructure management faces several challenges:
- Inconsistency: Manual steps vary between operators and environments
- Undocumented: Critical knowledge exists only in operators’ heads
- Error-Prone: Human mistakes during repetitive tasks
- Slow: Manual provisioning takes hours or days
- Untrackable: No audit trail of what changed, when, or why
- Irreproducible: Difficulty recreating environments exactly
The IaC solution
Infrastructure as Code addresses these challenges by making infrastructure:
Declarative - Describe the desired state, not the steps to achieve it. The IaC tool handles the implementation details.
Versioned - Every infrastructure change is committed to Git, providing complete history and the ability to rollback.
Automated - Infrastructure deploys through pipelines without human intervention, eliminating manual errors.
Testable - Infrastructure changes can be validated before production deployment.
Documented - The code itself is the documentation, always current and accurate.
Reproducible - The same code produces identical infrastructure every time, across all environments.
Core Concepts
Declarative vs imperative
Imperative approaches specify the exact steps: “Create a server, then install software, then configure networking.”
Declarative approaches specify the desired outcome: “I need a server with this software and network configuration.” The IaC tool determines the necessary steps.
Most modern IaC tools use the declarative approach, making them more maintainable and resilient.
State Management
IaC tools maintain a “state” - a record of what infrastructure currently exists. When you change your code and re-run the tool, it compares the desired state (your code) with the actual state (what exists) and makes only the necessary changes.
This enables:
- Drift detection - Identify manual changes made outside IaC
- Safe updates - Modify only what changed
- Dependency management - Update resources in the correct order
Idempotency
Running the same IaC code multiple times produces the same result. If infrastructure already matches the code, the tool makes no changes. This property is called idempotency and is essential for reliable automation.
Infrastructure as Code in EDP
The Edge Developer Platform uses IaC extensively:
Terraform is our primary IaC tool for provisioning cloud resources. We use Terragrunt as an orchestration layer to manage multiple Terraform modules and reduce code duplication.
Our implementation includes:
- infra-catalogue - Reusable infrastructure components (modules, units, and stacks)
- infra-deploy - Full environment definitions using catalogue components
We organize infrastructure into stacks - coherent bundles of related components:
Each stack is defined as code, versioned independently, and can be deployed across different environments.
GitOps integration
Our IaC integrates with GitOps principles:
- All infrastructure definitions live in Git repositories
- Changes go through code review processes
- Automated pipelines deploy infrastructure
- ArgoCD continuously reconciles Kubernetes resources with Git state
This creates an auditable, automated, and reliable deployment process.
Benefits realized
Consistency across environments
Development, testing, and production environments are deployed from the same code. This eliminates the “works on my machine” problem at the infrastructure level.
Rapid environment provisioning
A complete EDP environment can be provisioned in minutes rather than days. This enables:
- Quick disaster recovery
- Easy creation of test environments
- Fast onboarding for new team members
Reduced operational risk
Code review catches infrastructure errors before deployment. Automated testing validates changes. Version control enables instant rollback if problems occur.
Knowledge sharing
Infrastructure configuration is explicit and discoverable in code. New team members can understand the platform by reading the repository rather than shadowing experienced operators.
Compliance and auditability
Every infrastructure change is tracked in Git history with author, timestamp, and reason. This provides audit trails required for compliance and simplifies troubleshooting.
Getting started
To work with EDP’s Infrastructure as Code:
- Understand Terraform basics - Review Terraform documentation
- Explore infra-catalogue - Browse infra-catalogue to understand available components
- Review existing deployments - Examine infra-deploy to see how components are composed
- Follow the Terraform guide - See Terraform-based deployment for detailed instructions
Best Practices
Based on our experience building and operating IaC:
Version everything - All infrastructure code belongs in version control. No exceptions.
Keep it simple - Start with basic modules. Add abstraction only when duplication becomes painful.
Test before production - Deploy infrastructure changes to test environments first.
Use meaningful commit messages - Explain why changes were made, not just what changed.
Review all changes - Infrastructure changes should go through the same review process as application code.
Document assumptions - Use code comments to explain non-obvious decisions.
Manage secrets securely - Never commit credentials to version control. Use secret management tools.
Plan for drift - Regularly compare actual infrastructure with code state to detect manual changes.
Challenges and limitations
Infrastructure as Code is powerful but has challenges:
Learning curve - Teams need to learn IaC tools and practices. Initial productivity may decrease.
State management complexity - State files must be stored securely and accessed by multiple team members. State corruption can cause serious issues.
Provider limitations - Not all infrastructure can be managed as code. Some resources require manual configuration.
Breaking changes - Poorly written code can destroy infrastructure. Safeguards and testing are essential.
Tool lock-in - Switching IaC tools (e.g., Terraform to Pulumi) requires rewriting infrastructure code.
Despite these challenges, the benefits far outweigh the costs for any infrastructure of meaningful complexity.
Why we invest in IaC
The IPCEI-CIS Edge Developer Platform requires reliable, reproducible infrastructure. Manual provisioning cannot meet these requirements at scale.
By investing in Infrastructure as Code:
- We can deploy complete environments consistently
- Platform engineers can focus on improvement rather than repetitive tasks
- Infrastructure changes are transparent and auditable
- New team members can contribute confidently
- Disaster recovery becomes routine rather than heroic
Our IaC tools (infra-catalogue and infra-deploy) embody these principles and enable the platform’s reliability.
Additional Resources
Infrastructure as Code Concepts
EDP-Specific Resources
2.2.1 - Terraform-based deployment of EDP
As-code definitions of EDP clusters, so they can be deployed reliably and consistently on OTC whenever needed.
Overview
The infra-deploy and infra-catalogue repositories work together to provide a framework for deploying Edge Developer Platform instances.
infra-catalogue contains individual, atomic infrastructure components: terraform modules and terragrunt units and stacks, such as Kubernetes clusters and Postgres databases.
infra-deploy then contains full definitions of stacks built using these components - such as the production site at edp.buildth.ing. It also includes scripts with which to deploy these stacks.
Note that both repositories rely on the wide range of features available on OTC. Several of these features, such as S3-compatible storage and on-demand managed Postgres instances, are not yet available on more sovereign clouds such as Edge, so these are not currently supported.
Key Features
- ‘Catalogue’ of infrastructure stacks to be used in deployments
- Definition of deployment stacks for each environment in prod or dev
- Scripts to govern deployment, installation and drift-correction of EDP
Purpose in EDP
For our Edge Developer Platform to be reliable it must be deployable in a consistent manner. When errors occur, or after any manual alterations, the system can then be safely reset to a working state. This state should be provided in code to allow for automated validation and deployment, and to allow it to be deployed from an always-identical CI/CD pipeline rather than a variable local deployment environment.
Repositories
Infra-deploy: https://edp.buildth.ing/DevFW/infra-deploy
Infra-catalogue: https://edp.buildth.ing/DevFW/infra-catalogue
Getting Started
Prerequisites
Quick Start
- Set up OTC credentials per README section
- Set cluster environment and run install script per README section
Alternatively, manually trigger automated deployment pipeline.
- You will be asked for essential information like the deployment name and tenant.
- Any fields marked
INITIAL only need to be set when first creating an environment - Thereafter, the cached values are used and the
INITIAL values provided to the pipeline are ignored.- Specifically, they are cached in a
terragrunt.values.hcl file within infra-deploy/<tenant>/<cluster-name>, where both variables are set in the pipeline - e.g. prod/edp or nonprod/garm-provider-test
Verification
After the deploymenet completes, and a short startup time, you should be able to access your Forgejo instance at <cluster-name>.buildth.ing (production tenant) or <cluster-name>.t09.de (non-prod tenant). <cluster-name> is the name you provided in the deployment pipeline, or the $CLUSTER_ENVIRONMENT variable when running manually.
For example, the primary production cluster is called edp and can be accessed at edp.buildth.ing.
Screens
Deployment using production pipeline:
 …
…

Configuration
Configuration of clusters is done in two ways. The first, mentioned above, is to provide INITIAL configuration when creating a new cluster. Thereafter, configuration is done within the relevant infra-deploy/<tenant> directory (e.g. prod/edp). Variables may be changed within the terragrunt.values.hcl file, but equally the terragrunt.stack.hcl file contains references to the lower-level code set up in infra-catalogue.
These are organised in layers, according to Terragrunt’s natural structure. First is a stack, a high-level abstraction for a whole cluster. This in turn references terragrunt units, which in turn are wrappers around standard Terraform modules.
When deployed, the Terraform modules require a provider.tf file which is automatically generated by Terragrunt using tenant-level and global configuration stored in infra-deploy.
When deploying manually (e.g. with install.sh), you can observe these layers as Terragrunt will cache them on your machine, within the .terragrunt-stack/ directory generated within /<tenant>/<cluster-name>/.
Troubleshooting
Version updates
Problem: Updates to infra-catalogue are not immediately reflected in deployed clusters, even after running deploy.
Solution: Versions must be updated.
Each cluster deployment specifies a catalogue version in its terragrunt.values.hcl; this refers to a tag in infra-catalogue. Within infra-catalogue, stacks reference units and modules from the same tag.
Thus, to test a new change to infra-catalogue, first make a new tag, then update the relevant values file to point to it.
Status
Maturity: TRL-9
Additional Resources
2.2.2 - Stacks
Platform-level component provisioning via Stacks
Overview
The stacks and stacks-instances repositories form the core of a GitOps-based system for provisioning Edge Developer Platforms (EDP). They implement a template-instance pattern that enables the deployment of reusable platform components across different environments. The concept of “stacks” originates from the CNOE.io project (Cloud Native Operational Excellence), which can be traced through the evolutionary development from edpbuilder (derived from CNOE.io’s EDPbuilder) to infra-deploy.
Key Features of the Everything-as-Code Stacks Approach
This declarative Stacks provisioning architecture is characterized by the following central properties:
Complete Code Declaration
Platform as Code: All Kubernetes resources, Helm charts, and application manifests are declaratively versioned as YAML files. The entire platform topology is traceable in Git.
Configuration as Code: Environment-specific configurations are generated through template hydration, not manually edited. Gomplate transforms generic templates into concrete configurations.
GitOps-Native Architecture
Single Source of Truth: Git is the sole source of truth for the desired state of all infrastructure and platform components.
Declarative State Management: ArgoCD continuously synchronizes the actual state with the desired state defined in Git. Deviations are automatically corrected.
Audit Trail: Every change to infrastructure or platform is documented through Git commits, with author, timestamp, and change description.
Pull-based Deployment: ArgoCD pulls changes from Git, rather than external systems requiring push access to the cluster. This significantly increases security.
Template-Instance Separation
DRY Principle (Don’t Repeat Yourself): Common platform components are defined once as templates and reused for all environments.
Environment Promotion: New environments can be quickly created through template hydration. Consistency across environments is guaranteed.
Centralized Maintainability: Updates to stack definitions can be made centrally in the stacks repository and then selectively rolled out to instances.
Customization Points: Despite reuse, environment-specific customizations remain possible through values files and manifest overlays.
Modular Composition
Stack-based Architecture: Platform capabilities are organized into independent, reusable stacks (core, otc, forgejo, observability).
Selective Deployment: Through the STACKS environment variable, only required components can be deployed selectively.
Mix-and-Match: Different stack combinations yield different platform profiles (Development, Production, Observability clusters).
Pluggable Components: New stacks can be added without modifying existing ones.
Environment Agnosticism
Cloud Provider Abstraction: Templates are formulated generically. Provider-specific details are introduced through hydration.
Multi-Cloud Ready: The architecture supports various cloud providers (currently OTC, historically KIND, extensible to AWS/Azure/GCP).
Environment Variables as Interface: All environment-specific aspects are controlled through clearly defined environment variables.
Portable Definitions: Stack definitions can be ported between environments and even cloud providers.
Self-Healing and Drift Detection
Automated Reconciliation: ArgoCD detects deviations from the desired state and corrects them automatically.
Continuous Monitoring: Permanent monitoring of cluster state compared to Git definition.
Declarative State Recovery: After failures or manual changes, the declared state is automatically restored.
Sync Policies: Configurable sync strategies (automated, manual, with pruning) per application.
Secrets Management
Secrets Outside Git: Sensitive data is not stored in Git but generated at runtime or injected from secret stores.
Generated Credentials: Passwords, tokens, and secrets are generated during deployment and directly created as Kubernetes Secrets.
Sealed Secrets Ready: The architecture is compatible with Sealed Secrets or External Secrets Operators for encrypted secret storage in Git.
Credential Rotation: Secrets can be regenerated through re-deployment.
Observability and Auditability
Declarative Monitoring: Observability stacks are part of the Platform-as-Code definition.
Deployment History: Complete history of all deployments and changes through Git log.
ArgoCD UI: Graphical representation of sync status and application topology.
Infrastructure Events: Terraform state changes and Terragrunt outputs document infrastructure changes.
Idempotence and Reproducibility
Idempotent Operations: Repeated execution of the same declaration leads to the same result without side effects.
Deterministic Builds: Same input parameters (Git commit + environment variables) produce identical environments.
Disaster Recovery: Complete environments can be rebuilt from code without restoring backups.
Testing in Production-Like Environments: Development and staging environments are code-identical to production, only with different parameter values.
Purpose in EDP
A ‘stack’ is the declarative description for the platform provisionning in an EDP installation.
Repository
Code:
Documentation: [Link to component-specific documentation]
The stacks Repository
Purpose and Structure
The stacks repository contains reusable template definitions for platform components. It serves as a central library of building blocks from which Edge Developer Platforms can be composed.
stacks/
└── template/
    ├── edfbuilder.yaml
    ├── registry/
    │   ├── core.yaml
    │   ├── otc.yaml
    │   ├── forgejo.yaml
    │   ├── observability.yaml
    │   └── observability-client.yaml
    └── stacks/
        ├── core/
        ├── otc/
        ├── forgejo/
        ├── observability/
        └── observability-client/
Components
edfbuilder.yaml: The central bootstrap definition. This is an ArgoCD Application that references the registry directory and serves as the entry point for the entire platform provisioning.
registry/: Contains ArgoCD ApplicationSets that function as a meta-layer. Each file defines a category of stacks (e.g., core, forgejo, observability) and references the corresponding subdirectory in stacks/.
stacks/: The actual platform components, organized into thematic categories:
- core: Fundamental components such as ArgoCD, CloudNative PostgreSQL, Dex (SSO)
- otc: Cloud-provider-specific components for Open Telekom Cloud (cert-manager, ingress-nginx, StorageClasses)
- forgejo: Git server and CI runners
- observability: Central observability components (Grafana, Victoria Metrics Stack)
- observability-client: Client-side metrics collection for non-observability clusters
Each stack consists of:
- YAML definitions (primarily ArgoCD Applications)
values.yaml files for Helm chartsmanifests/ directories for additional Kubernetes resources
Templating Mechanism
The templates use Gomplate with delimiter syntax {{{ }}} for environment variables:
repoURL: "https://{{{ .Env.CLIENT_REPO_DOMAIN }}}/{{{ .Env.CLIENT_REPO_ORG_NAME }}}"
path: "{{{ .Env.CLIENT_REPO_ID }}}/{{{ .Env.DOMAIN }}}/stacks/core"
These placeholders are replaced with environment-specific values during the deployment phase.
The stacks-instances Repository
Purpose and Structure
The stacks-instances repository contains the materialized, environment-specific configurations. While stacks provides the blueprints, stacks-instances contains the actual deployment definitions for concrete environments.
stacks-instances/
└── otc/
    ├── osctest.t09.de/
    │   ├── edfbuilder.yaml
    │   ├── registry/
    │   └── stacks/
    ├── backup-test-manu.t09.de/
    │   ├── edfbuilder.yaml
    │   ├── registry/
    │   └── stacks/
    └── ...
Organizational Principle
The structure follows the schema {cloud-provider}/{domain}/:
- cloud-provider: Identifies the cloud environment (e.g.,
otc for Open Telekom Cloud) - domain: The fully qualified domain name of the environment (e.g.,
osctest.t09.de)
Each environment replicates the structure of stacks/template, but with resolved template variables and environment-specific customizations.
Usage by ArgoCD
ArgoCD synchronizes directly from this repository. Applications reference paths such as:
source:
  path: "otc/osctest.t09.de/stacks/core"
  repoURL: "https://edp.buildth.ing/DevFW-CICD/stacks-instances"
  targetRevision: HEAD
This enables true GitOps: every change to the configurations is traceable through Git commits and automatically synchronized by ArgoCD in the target environment.
The infra-deploy Repository
Role in the Overall Architecture
The infra-deploy repository is the orchestration layer that coordinates both infrastructure and platform provisioning. It represents the evolution of edpbuilder, which was originally derived from the CNOE.io project’s EDPbuilder.
Two-Phase Provisioning
Phase 1: Infrastructure Provisioning
Uses Terragrunt Stacks (experimental feature) to provision cloud resources:
infra-deploy/
├── root.hcl
├── non-prod/
│   ├── tenant.hcl
│   ├── dns_zone/
│   │   ├── terragrunt.hcl
│   │   ├── terragrunt.stack.hcl
│   │   └── terragrunt.values.hcl
│   └── testing/
├── prod/
└── templates/
    └── forgejo/
        ├── terragrunt.hcl
        └── terragrunt.stack.hcl
Terragrunt Stacks provision:
- VPC and network segments
- Kubernetes clusters (CCE on OTC)
- Managed databases (RDS PostgreSQL)
- Load balancers and DNS entries
- Security groups and other cloud resources
Phase 2: Platform Provisioning
The script scripts/edp-install.sh executes the following steps:
Template Hydration:
- Checkout of the
stacks repository - Execution of Gomplate to resolve template variables
- Generation of environment-specific manifests
Instance Management:
- Checkout/update of the
stacks-instances repository - During CI execution: commit and push of the new instance
Secrets Management:
- Generation of credentials (database passwords, SSO secrets, API tokens)
- Creation of Kubernetes Secrets
Bootstrap:
- Helm-based installation of ArgoCD
- Application of
edfbuilder.yaml or selective registry entries
GitOps Handover:
- ArgoCD takes over further synchronization from
stacks-instances - Continuous monitoring and self-healing
GitHub Actions Workflows
The .github/workflows/ directory contains three central workflows:
deploy.yaml: Complete deployment pipeline with the following inputs:
- Cluster environment and tenant (prod/non-prod)
- Node flavor and availability zone
- Stack selection (core, otc, forgejo, observability, etc.)
- Infra-catalogue version
plan.yaml: Terraform/Terragrunt plan preview without execution
destroy.yaml: Controlled teardown of environments
Deployment Workflow
The complete provisioning process proceeds as follows:
Initiation: GitHub Actions workflow is triggered (manually or automatically)
Environment Preparation:
export CLUSTER_ENVIRONMENT=qa-stage
cd scripts
./new-otc-env.sh  # Creates Terragrunt configuration if new
Infrastructure Provisioning:
./ensure-cluster.sh otc
# Internally executes:
# - ./ensure-otc-cluster.sh
# - terragrunt stack run apply
Platform Provisioning:
./edp-install.sh
# Executes:
# - Checkout of stacks
# - Gomplate hydration
# - Checkout/update of stacks-instances
# - Secrets generation
# - ArgoCD installation
# - Bootstrap of stacks
ArgoCD Synchronization: ArgoCD continuously reads from stacks-instances and synchronizes the desired state
The CNOE.io Stacks Concept
The term “stacks” originates from the Cloud Native Operational Excellence (CNOE.io) project. The core idea is the composition of platform capabilities from modular, reusable building blocks.
Principles
Modularity: Each stack is a self-contained unit with clear dependencies
Composability: Stacks can be freely combined to create different platform profiles
Declarativeness: All configurations are declarative and GitOps-capable
Environment-agnostic: Templates are generic; environment specifics are introduced through hydration
Stack Selection and Combinations
The environment variable STACKS controls which components are deployed:
# Complete EDP with central observability
STACKS="core,otc,forgejo,observability"

# Application cluster with client-side observability
STACKS="core,otc,forgejo,observability-client"

# Minimal development environment
STACKS="core,forgejo"
Data Flow and Dependencies
┌─────────────────┐
│  GitHub Actions │
│  (deploy.yaml)  │
└────────┬────────┘
         │
         ├─> Phase 1: Infrastructure
         │   ┌──────────────────┐
         │   │  infra-deploy    │
         │   │  (Terragrunt)    │
         │   └────────┬─────────┘
         │            │
         │            v
         │   ┌──────────────────┐
         │   │  Cloud Provider  │
         │   │  (OTC)           │
         │   │  - VPC           │
         │   │  - K8s Cluster   │
         │   │  - RDS           │
         │   └──────────────────┘
         │
         └─> Phase 2: Platform
             ┌──────────────────┐
             │  edp-install.sh  │
             └────────┬─────────┘
                      │
                      ├─> Checkout: stacks (Templates)
                      │   └─> Gomplate Hydration
                      │
                      ├─> Checkout/Update: stacks-instances
                      │
                      ├─> Secrets Generation
                      │
                      ├─> ArgoCD Installation (Helm)
                      │
                      └─> Bootstrap (edfbuilder.yaml)
                          │
                          v
                 ┌────────────────┐
                 │    ArgoCD      │
                 └────────┬───────┘
                          │
                          └─> Continuous Synchronization
                              from stacks-instances
                              │
                              v
                       ┌──────────────┐
                       │  Kubernetes  │
                       │  Cluster     │
                       └──────────────┘
Historical Context: edpbuilder to infra-deploy
The evolution from edpbuilder to infra-deploy demonstrates the maturation of the architecture:
edpbuilder (Origin):
- Directly derived from CNOE.io’s
EDPbuilder - Focus on local KIND clusters
- Manual configuration
- Monolithic structure
infra-deploy (Current):
- Production-ready for cloud deployments (OTC)
- Terragrunt-based infrastructure orchestration
- CI/CD integration via GitHub Actions
- Clear separation between infrastructure and platform
- Template-instance separation through stacks/stacks-instances
Technical Particularities
Gomplate Templating
Gomplate is used with custom delimiters {{{ }}} to avoid conflicts with Helm templating ({{ }}):
gomplate --input-dir="stacks/template" \
         --output-dir="work" \
         --left-delim "{{{" \
         --right-delim "}}}"
Terragrunt Experimental Stacks
The use of Terragrunt Stacks requires the experimental flag:
export TG_EXPERIMENT_MODE=true
terragrunt stack run apply
This enables hierarchical organization of Terraform modules with dependency management.
ArgoCD ApplicationSets
The registry pattern uses ArgoCD Applications that reference directories:
source:
  path: "otc/osctest.t09.de/stacks/core"
ArgoCD automatically detects all YAML files in the path and synchronizes them as Applications.
Best Practices and Patterns
Immutable Infrastructure: Every environment is fully defined in Git
Secrets Outside Git: Sensitive data is generated at runtime or injected from secret stores
Progressive Rollouts: New environments start as template instances, then are individually customized
Version Pinning: Critical components (Helm charts, Terragrunt modules) are pinned to specific versions
Namespace Isolation: Each stack deploys into dedicated namespaces
Self-Healing: ArgoCD’s automated sync policy enables automatic drift correction
Usage Examples
Deployment by Pipeline
The platform deployment is the second part of the EDP installtaion. First there is the infrastructure setup, which ends with a created kubernetes cluster. Then the platform provisioning by the defined stacks is done. Both is runnable by the deploypipelien in infra-deploy:
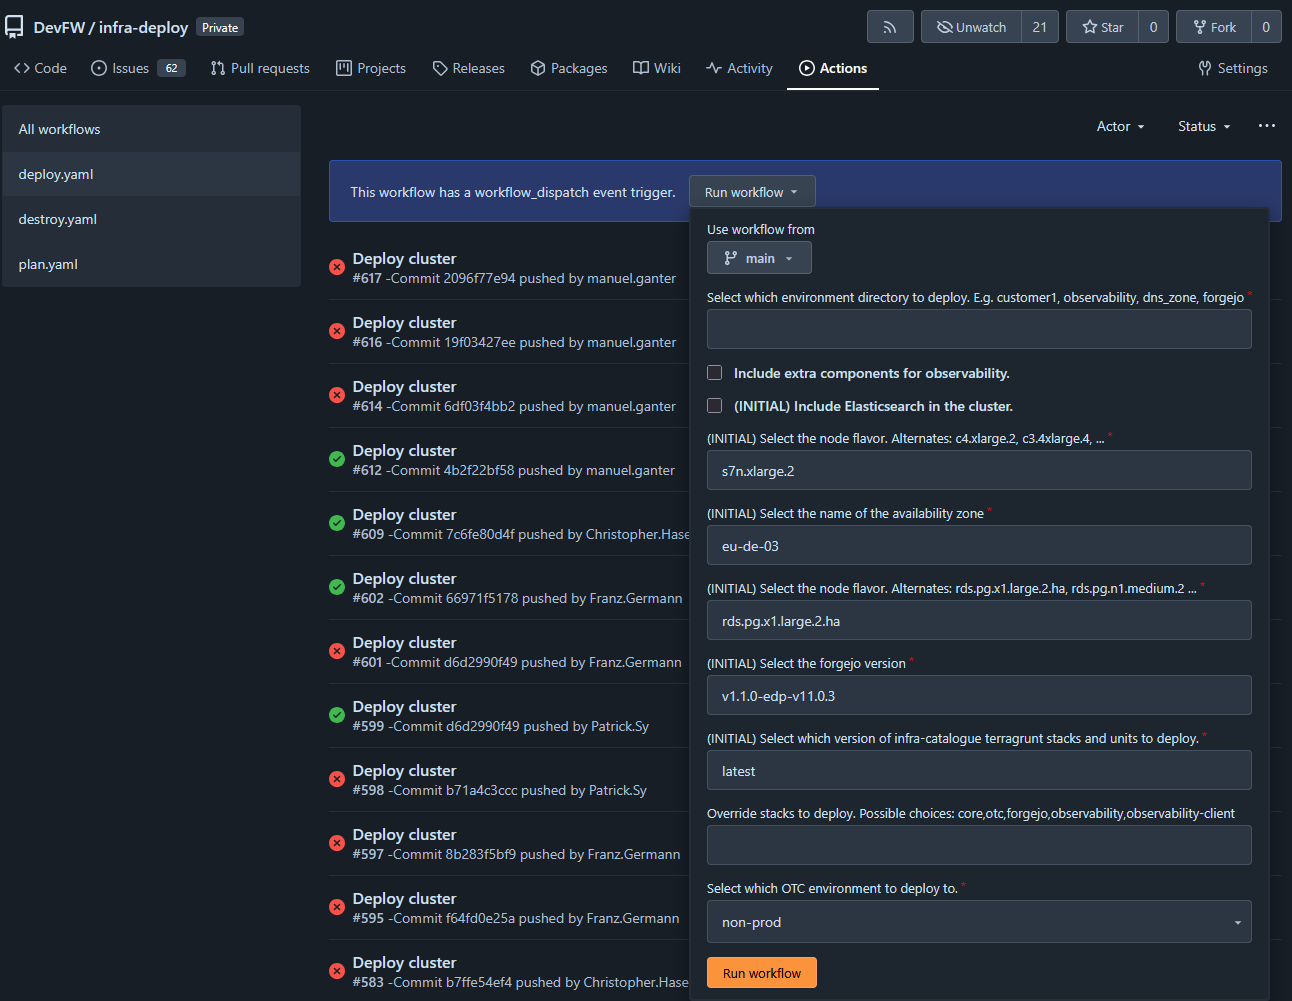
The green pipeline looks liek this:
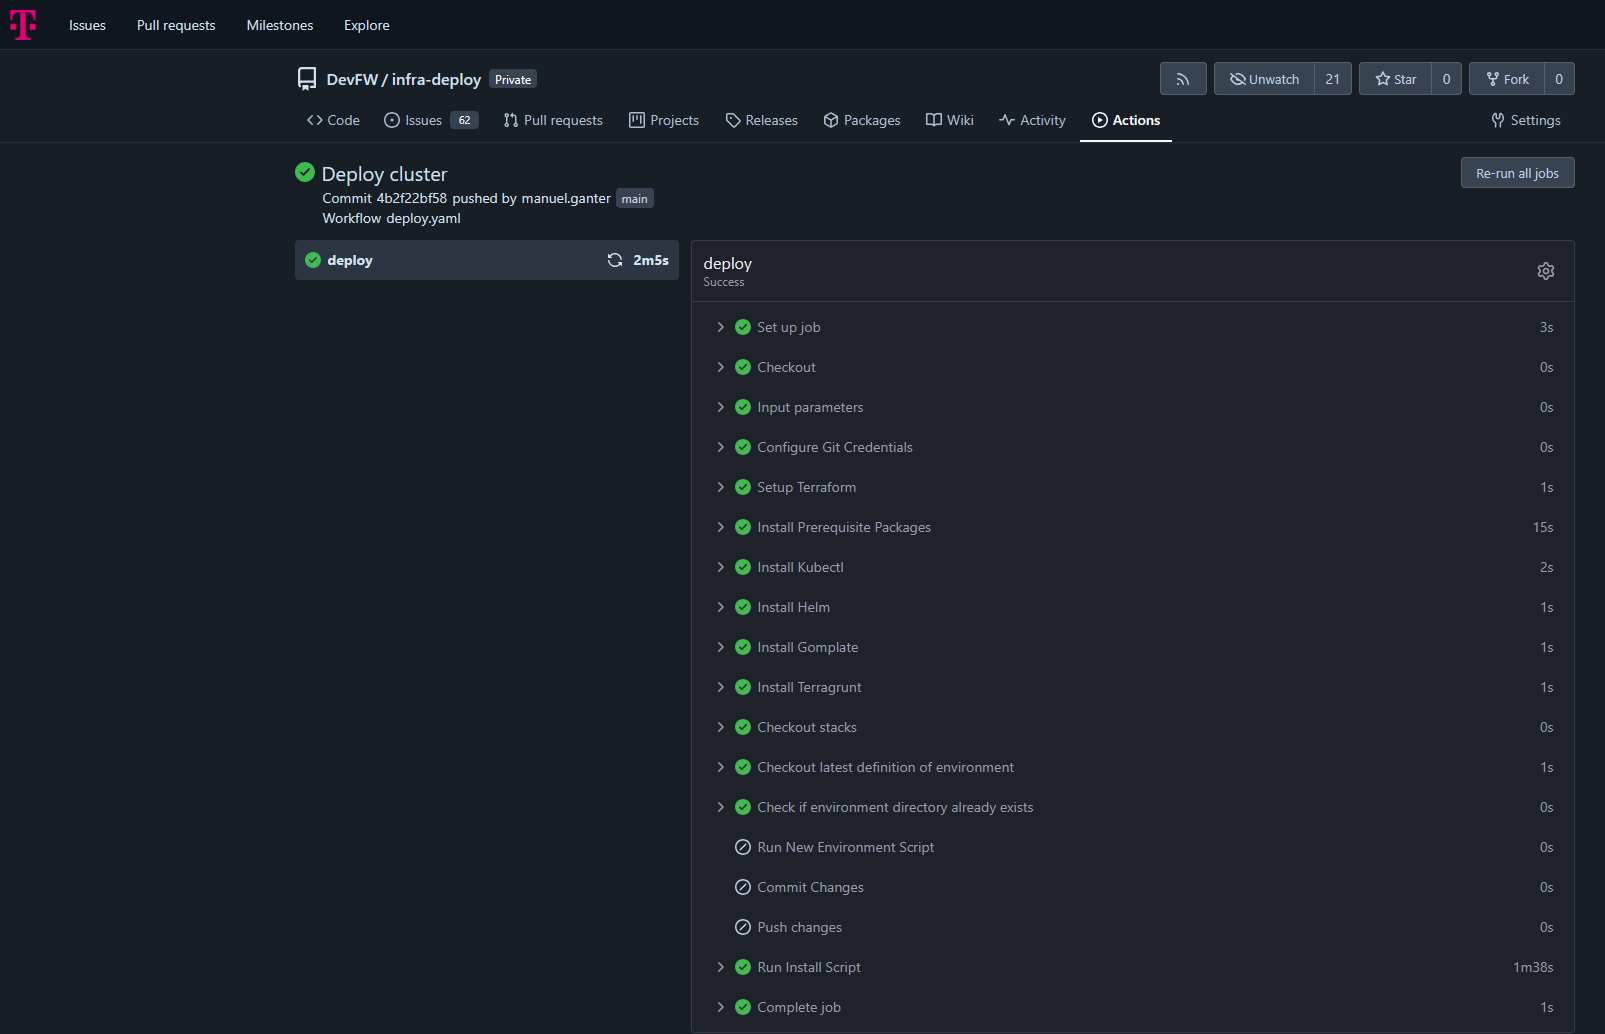
Local setup with ‘kind’
It’s also possible to just run the second part, the stcks provisionning. Then you need to have a kubernetes cluster already running, which is e.g. feasable by a local kind-cluster.
So imagine, you want to to the stacks ‘core,observability’ on your local machine. Then you can run the local entzr
# have kind insatlled
# in /infra-deploy

# provide a kind cluster
kind delete clusters --all
./scripts/ensure-kind-cluster.sh -r

# provide some emnv vars
export TERRAFORM=/bin/bash
export LOADBALANCER_ID=ABC
export DOMAIN=ABC
export DOMAIN_GITEA=ABC
export OS_ACCESS_KEY=ABC
export OS_SECRET_KEY=ABC
export STACKS=core,observability

# deploy
./scripts/edp-install.sh
Status
Maturity: [Production]
Additional Resources
2.2.2.1 - Core
Essential infrastructure components for GitOps, database management, and single sign-on
Overview
The Core stack provides foundational infrastructure components required by all other Edge Developer Platform stacks. It establishes the base layer for continuous deployment, database services, and centralized authentication, enabling a secure, scalable platform architecture.
The Core stack deploys ArgoCD for GitOps orchestration, CloudNativePG for PostgreSQL database management, and Dex for OpenID Connect single sign-on capabilities.
Key Features
- GitOps Continuous Deployment: ArgoCD manages declarative infrastructure and application deployments
- Database Operator: CloudNativePG provides enterprise-grade PostgreSQL clusters for platform services
- Single Sign-On: Dex offers centralized OIDC authentication across platform components
- Automated Synchronization: Self-healing deployments with automatic drift correction
- Role-Based Access Control: Integrated RBAC for secure platform administration
- TLS Certificate Management: Automated certificate provisioning and renewal
Repository
Code: Core Stack Templates
Documentation:
Getting Started
Prerequisites
- Kubernetes cluster (1.24+)
- kubectl configured with cluster access
- Ingress controller (nginx recommended)
- cert-manager for TLS certificate management
- Domain names configured for platform services
Quick Start
The Core stack is deployed as the foundation of the EDP installation:
Trigger Deploy Pipeline
- Go to Infra Deploy Pipeline
- Click on Run workflow
- Enter a name in “Select environment directory to deploy”. This must be DNS Compatible. (if you enter
test-me then domains will be argocd.test-me.t09.de, dex.test-me.t09.de) - Execute workflow
ArgoCD Bootstrap
The deployment automatically provisions:
- ArgoCD control plane in
argocd namespace - CloudNativePG operator in
cloudnative-pg namespace - Dex identity provider in
dex namespace - Ingress configurations with TLS certificates
- OIDC authentication integration
Verification
Verify the Core stack deployment:
# Check ArgoCD installation
kubectl get application -n argocd
kubectl get pods -n argocd

# Verify CloudNativePG operator
kubectl get pods -n cloudnative-pg
kubectl get crd | grep cnpg.io

# Check Dex deployment
kubectl get pods -n dex
kubectl get ingress -n dex

# Verify ingress configurations
kubectl get ingress -n argocd
Access ArgoCD at https://argocd.{DOMAIN} and authenticate via Dex SSO. Or use username admin and the secret inside of kubernetes argocd/argocd-initial-admin-secret as password kubectl get secret -n argocd argocd-initial-admin-secret -ojson | jq -r .data.password | base64 -d.
Architecture
Component Architecture
The Core stack establishes a three-tier foundation:
ArgoCD Control Plane:
- Application management and GitOps reconciliation
- Multi-repository tracking with automated sync
- Resource health monitoring and drift detection
- Integrated RBAC with SSO authentication
CloudNativePG Operator:
- PostgreSQL cluster lifecycle management
- Automated backup and recovery
- High availability and failover
- Storage provisioning via CSI drivers
Dex Identity Provider:
- OpenID Connect authentication service
- Multiple connector support (Forgejo/Gitea, LDAP, SAML)
- Static client registration for platform services
- Token issuance and validation
Networking
Ingress Architecture:
- nginx ingress controller for external access
- TLS termination with cert-manager integration
- Domain-based routing for platform services
Kubernetes Services:
- Internal service communication via ClusterIP
- DNS-based service discovery
- Network policies for security segmentation
Configuration
ArgoCD Configuration
Deployed via Helm chart v9.1.5 with custom values in stacks/core/argocd/values.yaml:
OIDC Authentication:
configs:
  cm:
    url: "https://{DOMAIN_ARGOCD}"
    oidc.config: |
      name: Forgejo
      issuer: https://{DOMAIN_DEX}
      clientID: controller-argocd-dex
      clientSecret: $dex-controller-argocd-dex:dex-controller-argocd-dex
      requestedScopes: ["openid", "profile", "email", "groups"]
RBAC Policy:
policy.csv: |
  g, DevFW, role:admin
Server Settings:
- Insecure mode enabled (TLS handled by ingress)
- Annotation-based resource tracking
- 60-second reconciliation timeout
- Resource exclusions for ProviderConfigUsage and CiliumIdentity
CloudNativePG Configuration
Deployed via Helm chart v0.26.1 with values in stacks/core/cloudnative-pg/values.yaml:
Operator Settings:
- Namespace:
cloudnative-pg - Automated database cluster provisioning
- Custom resource definitions for Cluster, Database, and Pooler resources
Storage Configuration:
- Uses
csi-disk storage class by default - PVC provisioning for PostgreSQL data
- Backup storage integration (S3-compatible)
Dex Configuration
Deployed via Helm chart v0.23.0 with values in stacks/core/dex/values.yaml:
Issuer Configuration:
config:
  issuer: https://{DOMAIN_DEX}
  storage:
    type: memory  # Use persistent storage for production
  oauth2:
    skipApprovalScreen: true
    alwaysShowLoginScreen: false
Forgejo Connector:
connectors:
  - type: gitea
    id: forgejo
    name: Forgejo
    config:
      clientID: $FORGEJO_CLIENT_ID
      clientSecret: $FORGEJO_CLIENT_SECRET
      redirectURI: https://{DOMAIN_DEX}/callback
      baseURL: https://edp.buildth.ing
      orgs:
        - name: DevFW
Static OAuth2 Clients:
- ArgoCD:
controller-argocd-dex - Grafana:
controller-grafana-dex
Environment Variables
Core stack services use the following environment variables:
Domain Configuration:
DOMAIN_ARGOCD: ArgoCD web interface URLDOMAIN_DEX: Dex authentication service URLDOMAIN_GITEA: Forgejo/Gitea repository URLDOMAIN_GRAFANA: Grafana observability dashboard URL
Repository Configuration:
CLIENT_REPO_ID: Repository identifier for stack configurationsCLIENT_REPO_DOMAIN: Git repository domainCLIENT_REPO_ORG_NAME: Organization name for stack instances
Usage Examples
Managing Applications with ArgoCD
Access and manage applications through ArgoCD:
# Login to ArgoCD CLI
argocd login argocd.${DOMAIN} --sso

# List all applications
argocd app list

# Get application status
argocd app get coder

# Sync application manually
argocd app sync coder

# View application logs
argocd app logs coder

# Diff application state
argocd app diff coder
Creating a PostgreSQL Database
Deploy a PostgreSQL cluster using CloudNativePG:
# database-cluster.yaml
apiVersion: postgresql.cnpg.io/v1
kind: Cluster
metadata:
  name: app-db
  namespace: my-app
spec:
  instances: 3
  storage:
    size: 20Gi
    storageClass: csi-disk
  postgresql:
    parameters:
      max_connections: "100"
      shared_buffers: "256MB"
  bootstrap:
    initdb:
      database: appdb
      owner: appuser
Apply the configuration:
kubectl apply -f database-cluster.yaml

# Check cluster status
kubectl get cluster app-db -n my-app
kubectl get pods -n my-app -l cnpg.io/cluster=app-db

# Get connection credentials
kubectl get secret app-db-app -n my-app -o jsonpath='{.data.password}' | base64 -d
Configuring SSO for Applications
Add OAuth2 applications to Dex for SSO integration:
# Add to dex values.yaml
staticClients:
  - id: my-app-client
    redirectURIs:
      - 'https://myapp.{DOMAIN}/callback'
    name: 'My Application'
    secretEnv: MY_APP_CLIENT_SECRET
Configure the application to use Dex:
# Application OIDC configuration
OIDC_ISSUER=https://dex.${DOMAIN}
OIDC_CLIENT_ID=my-app-client
OIDC_CLIENT_SECRET=${MY_APP_CLIENT_SECRET}
OIDC_REDIRECT_URI=https://myapp.${DOMAIN}/callback
Deploying Applications via ArgoCD
Create an ArgoCD Application manifest:
# my-app.yaml
apiVersion: argoproj.io/v1alpha1
kind: Application
metadata:
  name: my-app
  namespace: argocd
spec:
  project: default
  source:
    repoURL: 'https://github.com/myorg/my-app'
    targetRevision: main
    path: k8s
  destination:
    server: 'https://kubernetes.default.svc'
    namespace: my-app
  syncPolicy:
    automated:
      prune: true
      selfHeal: true
    syncOptions:
      - CreateNamespace=true
Push it to stacks instances to be picked up by argo
Integration Points
- All Stacks: Core stack is a prerequisite for all other EDP stacks
- OTC Stack: Provides ingress-nginx and cert-manager dependencies
- Coder Stack: Uses CloudNativePG for workspace database management
- Forgejo Stack: Integrates with Dex for SSO and ArgoCD for deployment
- Observability Stack: Uses Dex for Grafana authentication and ArgoCD for deployment
- Provider Stack: Deploys Terraform providers via ArgoCD
Troubleshooting
ArgoCD Not Accessible
Problem: Cannot access ArgoCD web interface
Solution:
Verify ingress configuration:
kubectl get ingress -n argocd
kubectl describe ingress -n argocd
Check ArgoCD server status:
kubectl get pods -n argocd
kubectl logs -n argocd -l app.kubernetes.io/name=argocd-server
Verify TLS certificate:
kubectl get certificate -n argocd
kubectl describe certificate -n argocd
Test DNS resolution:
nslookup argocd.${DOMAIN}
Dex Authentication Failing
Problem: SSO login fails or redirects incorrectly
Solution:
Check Dex logs:
kubectl logs -n dex -l app.kubernetes.io/name=dex
Verify Forgejo connector configuration:
kubectl get secret -n dex
kubectl get configmap -n dex dex -o yaml
Test Dex issuer endpoint:
curl https://dex.${DOMAIN}/.well-known/openid-configuration
Verify OAuth2 client credentials match in both Dex and consuming application
CloudNativePG Operator Not Running
Problem: PostgreSQL clusters fail to provision
Solution:
Check operator status:
kubectl get pods -n cloudnative-pg
kubectl logs -n cloudnative-pg -l app.kubernetes.io/name=cloudnative-pg
Verify CRDs are installed:
kubectl get crd | grep cnpg.io
kubectl describe crd clusters.postgresql.cnpg.io
Check operator logs for errors:
kubectl logs -n cloudnative-pg -l app.kubernetes.io/name=cloudnative-pg --tail=100
Application Sync Failures
Problem: ArgoCD applications remain out of sync or fail to deploy
Solution:
Check application status:
argocd app get <app-name>
kubectl describe application <app-name> -n argocd
Review sync operation logs:
argocd app logs <app-name>
Verify repository access:
argocd repo list
argocd repo get <repo-url>
Check for resource conflicts or missing dependencies:
kubectl get events -n <app-namespace> --sort-by='.lastTimestamp'
Database Connection Issues
Problem: Applications cannot connect to CloudNativePG databases
Solution:
Verify cluster is ready:
kubectl get cluster <cluster-name> -n <namespace>
kubectl describe cluster <cluster-name> -n <namespace>
Check database credentials secret:
kubectl get secret <cluster-name>-app -n <namespace>
kubectl get secret <cluster-name>-app -n <namespace> -o yaml
Test connection from a pod:
kubectl run -it --rm psql-test --image=postgres:16 --restart=Never -- \
  psql "$(kubectl get secret <cluster-name>-app -n <namespace> -o jsonpath='{.data.uri}' | base64 -d)"
Review PostgreSQL logs:
kubectl logs -n <namespace> <cluster-name>-1
Additional Resources
2.2.2.2 - OTC
Open Telekom Cloud infrastructure components for ingress, TLS, and storage
Overview
The OTC (Open Telekom Cloud) stack provides essential infrastructure components for deploying applications on Open Telekom Cloud environments. It configures ingress routing, automated TLS certificate management, and cloud-native storage provisioning tailored specifically for OTC’s Kubernetes infrastructure.
This stack serves as a foundational layer that other platform stacks depend on for external access, secure communication, and persistent storage.
Key Features
- Automated TLS Certificate Management: Let’s Encrypt integration via cert-manager for automatic certificate provisioning and renewal
- Cloud Load Balancer Integration: Nginx ingress controller configured with OTC-specific Elastic Load Balancer (ELB) annotations
- Native Storage Provisioning: Default StorageClass using Huawei FlexVolume provisioner for block storage
- Prometheus Metrics: Built-in monitoring capabilities for ingress traffic and performance
- High Availability: Rolling update strategy with minimal downtime
- HTTP-01 Challenge Support: ACME validation through ingress for certificate issuance
Repository
Code: OTC Stack Templates
Documentation:
Getting Started
Prerequisites
- Kubernetes cluster running on Open Telekom Cloud
- ArgoCD installed (provided by
core stack) - Environment variables configured:
LOADBALANCER_ID: OTC Elastic Load Balancer IDLOADBALANCER_IP: OTC Elastic Load Balancer IP addressCLIENT_REPO_DOMAIN: Git repository domainCLIENT_REPO_ORG_NAME: Git repository organizationCLIENT_REPO_ID: Client repository identifierDOMAIN: Domain name for the environment
Quick Start
The OTC stack is deployed as part of the EDP installation process:
Trigger Deploy Pipeline
- Go to Infra Deploy Pipeline
- Click on Run workflow
- Enter a name in “Select environment directory to deploy”. This must be DNS Compatible.
- Execute workflow
ArgoCD Synchronization
ArgoCD automatically deploys:
- cert-manager with ClusterIssuer for Let’s Encrypt
- ingress-nginx controller with OTC load balancer integration
- Default StorageClass for OTC block storage
Verification
Verify the OTC stack deployment:
# Check ArgoCD applications status
kubectl get application otc -n argocd
kubectl get application cert-manager -n argocd
kubectl get application ingress-nginx -n argocd
kubectl get application storageclass -n argocd

# Verify cert-manager pods
kubectl get pods -n cert-manager

# Check ingress-nginx controller
kubectl get pods -n ingress-nginx

# Verify ClusterIssuer status
kubectl get clusterissuer main

# Check StorageClass
kubectl get storageclass default
Architecture
Component Architecture
The OTC stack consists of three primary components:
cert-manager:
- Automates TLS certificate lifecycle management
- Integrates with Let’s Encrypt ACME server (production endpoint)
- Uses HTTP-01 challenge validation via ingress
- Creates and manages certificates as Kubernetes resources
- Single replica deployment
ingress-nginx:
- Kubernetes ingress controller based on Nginx
- Routes external traffic to internal services
- Integrated with OTC Elastic Load Balancer (ELB)
- Supports TLS termination with cert-manager issued certificates
- Rolling update strategy with max 1 unavailable pod
- Prometheus metrics exporter with ServiceMonitor
StorageClass:
- Default storage provisioner for persistent volumes
- Uses Huawei FlexVolume driver (
flexvolume-huawei.com/fuxivol) - SATA block storage type
- Immediate volume binding mode
- Supports dynamic volume expansion
Integration Flow
External Traffic → OTC ELB → ingress-nginx → Kubernetes Services
                                    ↓
                              cert-manager (TLS certificates)
                                    ↓
                              Let's Encrypt ACME
Configuration
cert-manager Configuration
Helm Values (stacks/otc/cert-manager/values.yaml):
crds:
  enabled: true
replicaCount: 1
ClusterIssuer (stacks/otc/cert-manager/manifests/clusterissuer.yaml):
apiVersion: cert-manager.io/v1
kind: ClusterIssuer
metadata:
  name: main
spec:
  acme:
    email: admin@think-ahead.tech
    server: https://acme-v02.api.letsencrypt.org/directory
    privateKeySecretRef:
      name: cluster-issuer-account-key
    solvers:
    - http01:
        ingress:
          ingressClassName: nginx
Key Settings:
- CRDs installed automatically
- Production Let’s Encrypt ACME endpoint
- HTTP-01 validation through nginx ingress
- ClusterIssuer named
main for cluster-wide certificate issuance
ingress-nginx Configuration
Helm Values (stacks/otc/ingress-nginx/values.yaml):
controller:
  updateStrategy:
    type: RollingUpdate
    rollingUpdate:
      maxUnavailable: 1
  service:
    annotations:
      kubernetes.io/elb.class: union
      kubernetes.io/elb.port: '80'
      kubernetes.io/elb.id: {{{ .Env.LOADBALANCER_ID }}}
      kubernetes.io/elb.ip: {{{ .Env.LOADBALANCER_IP }}}
  ingressClassResource:
    name: nginx
  allowSnippetAnnotations: true
  config:
    proxy-buffer-size: 32k
    use-forwarded-headers: "true"
  metrics:
    enabled: true
    serviceMonitor:
      additionalLabels:
        release: "ingress-nginx"
      enabled: true
Key Settings:
- OTC Load Balancer Integration: Annotations configure connection to OTC ELB
- Rolling Updates: Minimizes downtime with 1 pod unavailable during updates
- Snippet Annotations: Enabled for advanced ingress configuration (idpbuilder compatibility)
- Proxy Buffer: 32k buffer size for handling large headers
- Forwarded Headers: Preserves original client information through proxies
- Metrics: Prometheus ServiceMonitor for observability
StorageClass Configuration
StorageClass (stacks/otc/storageclass/storageclass.yaml):
apiVersion: storage.k8s.io/v1
kind: StorageClass
metadata:
  annotations:
    storageclass.beta.kubernetes.io/is-default-class: "true"
  name: default
parameters:
  kubernetes.io/hw:passthrough: "true"
  kubernetes.io/storagetype: BS
  kubernetes.io/volumetype: SATA
  kubernetes.io/zone: eu-de-02
provisioner: flexvolume-huawei.com/fuxivol
reclaimPolicy: Delete
volumeBindingMode: Immediate
allowVolumeExpansion: true
Key Settings:
- Default StorageClass: Automatically used when no StorageClass specified
- OTC Zone: Provisioned in
eu-de-02 availability zone - SATA Volumes: Block storage (BS) with SATA performance tier
- Volume Expansion: Supports resizing persistent volumes dynamically
- Reclaim Policy: Volumes deleted when PersistentVolumeClaim is removed
ArgoCD Application Configuration
Registry Application (template/registry/otc.yaml):
- Name:
otc - Manages the OTC stack directory
- Automated sync with prune and self-heal enabled
- Creates namespaces automatically
Component Applications:
cert-manager (referenced in stack):
- Deploys cert-manager Helm chart
- Automated self-healing enabled
- Includes ClusterIssuer manifest for Let’s Encrypt
ingress-nginx (template/stacks/otc/ingress-nginx.yaml):
- Deploys from official Kubernetes ingress-nginx repository
- Chart version: helm-chart-4.12.1
- References environment-specific values from stacks-instances repository
storageclass (template/stacks/otc/storageclass.yaml):
- Deploys StorageClass manifest
- Managed as ArgoCD Application
- Automated sync with unlimited retries
Usage Examples
Creating an Ingress with Automatic TLS
Create an ingress resource that automatically provisions a TLS certificate:
apiVersion: networking.k8s.io/v1
kind: Ingress
metadata:
  name: my-app
  namespace: my-namespace
  annotations:
    cert-manager.io/cluster-issuer: main
    nginx.ingress.kubernetes.io/ssl-redirect: "true"
spec:
  ingressClassName: nginx
  tls:
  - hosts:
    - myapp.example.com
    secretName: myapp-tls
  rules:
  - host: myapp.example.com
    http:
      paths:
      - path: /
        pathType: Prefix
        backend:
          service:
            name: my-app-service
            port:
              number: 80
cert-manager will automatically:
- Detect the ingress with
cert-manager.io/cluster-issuer annotation - Create a Certificate resource
- Request certificate from Let’s Encrypt using HTTP-01 challenge
- Store certificate in
myapp-tls secret - Renew certificate before expiration
Creating a PersistentVolumeClaim
Use the default OTC StorageClass for persistent storage:
apiVersion: v1
kind: PersistentVolumeClaim
metadata:
  name: my-data
  namespace: my-namespace
spec:
  accessModes:
  - ReadWriteOnce
  resources:
    requests:
      storage: 10Gi
  storageClassName: csi-disk
Expanding an Existing Volume
Resize a persistent volume by editing the PVC:
# Edit the PVC storage request
kubectl patch pvc my-data -n my-namespace -p '{"spec":{"resources":{"requests":{"storage":"20Gi"}}}}'

# Verify expansion
kubectl get pvc my-data -n my-namespace
The volume will expand automatically due to allowVolumeExpansion: true in the StorageClass.
Custom Ingress Configuration
Use nginx ingress snippets for advanced routing:
apiVersion: networking.k8s.io/v1
kind: Ingress
metadata:
  name: advanced-app
  annotations:
    cert-manager.io/cluster-issuer: main
    nginx.ingress.kubernetes.io/configuration-snippet: |
      more_set_headers "X-Custom-Header: value";
      if ($http_user_agent ~* "bot") {
        return 403;
      }
spec:
  ingressClassName: nginx
  rules:
  - host: app.example.com
    http:
      paths:
      - path: /
        pathType: Prefix
        backend:
          service:
            name: app-service
            port:
              number: 8080
Integration Points
- Core Stack: Requires ArgoCD for deployment orchestration
- All Application Stacks: Depends on OTC stack for:
- External access via ingress-nginx
- TLS certificates via cert-manager
- Persistent storage via default StorageClass
- Observability Stack: ingress-nginx metrics exported to Prometheus
- Coder Stack: Uses ingress and cert-manager for workspace access
- Forgejo Stack: Requires ingress and TLS for Git repository access
Troubleshooting
Certificate Issuance Fails
Problem: Certificate remains in Pending state and is not issued
Solution:
Check Certificate status:
kubectl get certificate -A
kubectl describe certificate <cert-name> -n <namespace>
Verify ClusterIssuer is ready:
kubectl get clusterissuer main
kubectl describe clusterissuer main
Check cert-manager logs:
kubectl logs -n cert-manager -l app=cert-manager
Verify HTTP-01 challenge can reach ingress:
kubectl get challenges -A
kubectl describe challenge <challenge-name> -n <namespace>
Common issues:
- DNS not pointing to load balancer IP
- Firewall blocking HTTP (port 80) traffic
- Ingress class not set to
nginx - Let’s Encrypt rate limits exceeded
Ingress Controller Not Ready
Problem: ingress-nginx pods are not running or LoadBalancer service has no external IP
Solution:
Check ingress controller status:
kubectl get pods -n ingress-nginx
kubectl logs -n ingress-nginx -l app.kubernetes.io/component=controller
Verify LoadBalancer service:
kubectl get svc -n ingress-nginx
kubectl describe svc ingress-nginx-controller -n ingress-nginx
Check OTC load balancer annotations:
kubectl get svc ingress-nginx-controller -n ingress-nginx -o yaml
Verify environment variables are set correctly:
LOADBALANCER_ID matches OTC ELB IDLOADBALANCER_IP matches ELB public IP
Check OTC console for ELB configuration and health checks
Storage Provisioning Fails
Problem: PersistentVolumeClaim remains in Pending state
Solution:
Check PVC status:
kubectl get pvc -A
kubectl describe pvc <pvc-name> -n <namespace>
Verify StorageClass exists and is default:
kubectl get storageclass
kubectl describe storageclass default
Check volume provisioner logs:
kubectl logs -n kube-system -l app=csi-disk-plugin
Common issues:
- Insufficient quota in OTC project
- Invalid zone configuration (must be
eu-de-02) - Requested storage size exceeds limits
- Missing IAM permissions for volume creation
Ingress Returns 503 Service Unavailable
Problem: Ingress configured but returns 503 error
Solution:
Verify backend service exists:
kubectl get svc <service-name> -n <namespace>
kubectl get endpoints <service-name> -n <namespace>
Check if pods are ready:
kubectl get pods -n <namespace> -l <service-selector>
Verify ingress configuration:
kubectl describe ingress <ingress-name> -n <namespace>
Check nginx ingress logs:
kubectl logs -n ingress-nginx -l app.kubernetes.io/component=controller --tail=100
Test service connectivity from ingress controller:
kubectl exec -n ingress-nginx <controller-pod> -- curl http://<service-name>.<namespace>.svc.cluster.local:<port>
TLS Certificate Shows as Invalid
Problem: Browser shows certificate warning or certificate details are incorrect
Solution:
Verify certificate is ready:
kubectl get certificate <cert-name> -n <namespace>
Check certificate contents:
kubectl get secret <tls-secret-name> -n <namespace> -o jsonpath='{.data.tls\.crt}' | base64 -d | openssl x509 -text -noout
Ensure certificate covers the correct domain:
kubectl describe certificate <cert-name> -n <namespace>
Force certificate renewal if expired or incorrect:
kubectl delete certificate <cert-name> -n <namespace>
# cert-manager will automatically recreate it
Additional Resources
2.2.2.3 - Coder
Cloud Development Environments for secure, scalable remote development
Overview
Coder is an enterprise cloud development environment (CDE) platform that provisions secure, consistent remote development workspaces. As part of the Edge Developer Platform, Coder enables developers to work in standardized, on-demand environments defined as code, moving development workloads from local machines to centrally managed infrastructure.
The Coder stack deploys a self-hosted Coder instance with PostgreSQL database backend, integrated authentication, and edge connectivity capabilities.
Key Features
- Infrastructure as Code Workspaces: Development environments defined using Terraform templates
- IDE Agnostic: Supports browser-based IDEs, VS Code, JetBrains IDEs, and other development tools
- Secure Remote Access: Workspaces run in controlled cloud or on-premises infrastructure
- On-Demand Provisioning: Developers create ephemeral or persistent workspaces as needed
- AI Agent Support: Secure execution environment for AI coding assistants
- Template-Based Deployment: Reusable workspace templates ensure consistency across teams
Repository
Code: Coder Stack Templates
Documentation:
Getting Started
Prerequisites
- Kubernetes cluster with ArgoCD installed (provided by
core stack) - CloudNativePG operator (provided by
core stack) - Ingress controller configured (provided by
otc stack) - cert-manager for TLS certificate management (provided by
otc stack) - Domain name configured via
DOMAIN_GITEA environment variable
Quick Start
The Coder stack is deployed as part of the EDP installation process:
- Trigger Deploy Pipeline
- Go to Infra Deploy Pipeline
- Click on Run workflow
- Enter a name in “Select environment directory to deploy”. This must be DNS Compatible. (if you enter
test-me then the domain will be coder.test-me.t09.de) - Execute workflow
- ArgoCD Synchronization
ArgoCD automatically deploys:
- PostgreSQL database cluster (CloudNativePG)
- Coder application (Helm chart v2.28.3)
- Ingress configuration with TLS
- Database credentials and edge connectivity secrets
Verification
Verify the Coder deployment:
# Check ArgoCD application status
kubectl get application coder -n argocd

# Verify Coder pods are running
kubectl get pods -n coder

# Check PostgreSQL cluster status
kubectl get cluster coder-db -n coder

# Verify ingress configuration
kubectl get ingress -n coder
Access the Coder web interface at https://coder.{DOMAIN_GITEA}.
Architecture
Component Architecture
The Coder stack consists of:
Coder Control Plane:
- Web application for workspace management
- API server for workspace provisioning
- Terraform executor for infrastructure operations
PostgreSQL Database:
- Single-instance CloudNativePG cluster
- Stores workspace metadata, templates, and user data
- Managed database user with
coder-db-user secret - 10Gi persistent storage on
csi-disk storage class
Networking:
- ClusterIP service for internal communication
- Nginx ingress with TLS termination
- cert-manager integration for automatic certificate management
Configuration
Environment Variables
The Coder application is configured through environment variables in values.yaml:
Access Configuration:
CODER_ACCESS_URL: Public URL where Coder is accessible (https://coder.{DOMAIN_GITEA})
Database Configuration:
CODER_PG_CONNECTION_URL: PostgreSQL connection string (from coder-db-user secret)
Authentication:
CODER_OAUTH2_GITHUB_DEFAULT_PROVIDER_ENABLE: GitHub OAuth integration (disabled by default)
Edge Connectivity:
EDGE_CONNECT_ENDPOINT: Edge connection endpoint (from edge-credential secret)EDGE_CONNECT_USERNAME: Edge authentication usernameEDGE_CONNECT_PASSWORD: Edge authentication password
Helm Chart Configuration
Key Helm values configured in stacks/coder/coder/values.yaml:
coder:
  env:
    - name: CODER_ACCESS_URL
      value: "https://coder.{DOMAIN_GITEA}"
    - name: CODER_PG_CONNECTION_URL
      valueFrom:
        secretKeyRef:
          name: coder-db-user
          key: uri

  service:
    type: ClusterIP

  ingress:
    enable: true
    className: nginx
    host: "coder.{DOMAIN_GITEA}"
    annotations:
      cert-manager.io/cluster-issuer: main
    tls:
      enable: true
      secretName: coder-tls-secret
Important: Do not override CODER_HTTP_ADDRESS, CODER_TLS_ENABLE, CODER_TLS_CERT_FILE, or CODER_TLS_KEY_FILE as these are managed by the Helm chart.
PostgreSQL Database Configuration
Defined in stacks/coder/coder/manifests/postgres.yaml:
Cluster Specification:
- 1 instance (single-node cluster)
- Primary update strategy: unsupervised
- Resource requests/limits: 1 CPU, 1Gi memory
- Storage: 10Gi using
csi-disk storage class
Managed Roles:
- User:
coder - Permissions: createdb, login
- Password stored in
coder-db-user secret
ArgoCD Application Configuration
Registry Application (template/registry/coder.yaml):
- Name:
coder-reg - Manages the Coder stack directory
- Automated sync with prune and self-heal enabled
Stack Application (template/stacks/coder/coder.yaml):
- Name:
coder - Deploys Coder Helm chart v2.28.3 from
https://helm.coder.com/v2 - Automated self-healing enabled
- Creates namespace automatically
- References values from
stacks-instances repository
Usage Examples
Creating a Workspace Template
After deployment, create workspace templates using Terraform:
Access Coder Dashboard
open https://coder.${DOMAIN_GITEA}
Create Template Repository
Create a Git repository with a Terraform template:
# main.tf
terraform {
  required_providers {
    coder = {
      source  = "coder/coder"
      version = "~> 0.12"
    }
    kubernetes = {
      source  = "hashicorp/kubernetes"
      version = "~> 2.23"
    }
  }
}

resource "coder_agent" "main" {
  os   = "linux"
  arch = "amd64"
}

resource "kubernetes_pod" "main" {
  metadata {
    name      = "coder-${data.coder_workspace.me.owner}-${data.coder_workspace.me.name}"
    namespace = "coder-workspaces"
  }
  spec {
    container {
      name  = "dev"
      image = "codercom/enterprise-base:ubuntu"
      command = ["sh", "-c", coder_agent.main.init_script]
    }
  }
}
Push Template to Coder
coder templates push kubernetes-dev
Provisioning a Development Workspace
# Create a new workspace from template
coder create my-workspace --template kubernetes-dev

# Connect via SSH
coder ssh my-workspace

# Open in VS Code
coder open my-workspace --ide vscode

# Stop workspace when not in use
coder stop my-workspace

# Delete workspace
coder delete my-workspace
Access EDP platform services from Coder workspaces:
# Connect to platform PostgreSQL
psql "postgresql://myuser@postgres.core.svc.cluster.local:5432/mydb"

# Access Forgejo
git clone https://forgejo.${DOMAIN_GITEA}/myorg/myrepo.git

# Query platform metrics
curl https://grafana.${DOMAIN}/api/datasources
Integration Points
- Core Stack: Depends on ArgoCD for deployment orchestration and CloudNativePG operator for database management
- OTC Stack: Requires ingress-nginx controller and cert-manager for external access and TLS
- Forgejo Stack: Workspace templates can integrate with platform Git repositories
- Observability Stack: Workspace metrics can be collected by platform observability tools
- Dex (SSO): Can be configured for centralized authentication (requires additional configuration)
Troubleshooting
Coder Pods Not Starting
Problem: Coder pods remain in Pending or CrashLoopBackOff state
Solution:
Check PostgreSQL cluster status:
kubectl get cluster coder-db -n coder
kubectl describe cluster coder-db -n coder
Verify database credentials secret:
kubectl get secret coder-db-user -n coder
kubectl get secret coder-db-user -n coder -o jsonpath='{.data.uri}' | base64 -d
Check Coder logs:
kubectl logs -n coder -l app=coder
Cannot Access Coder UI
Problem: Coder web interface is not accessible at configured URL
Solution:
Verify ingress configuration:
kubectl get ingress -n coder
kubectl describe ingress -n coder
Check TLS certificate status:
kubectl get certificate -n coder
kubectl describe certificate coder-tls-secret -n coder
Verify DNS resolution:
nslookup coder.${DOMAIN_GITEA}
Database Connection Errors
Problem: Coder cannot connect to PostgreSQL database
Solution:
Verify PostgreSQL cluster health:
kubectl get pods -n coder -l cnpg.io/cluster=coder-db
kubectl logs -n coder -l cnpg.io/cluster=coder-db
Check database and user creation:
kubectl get database coder -n coder
kubectl exec -it coder-db-1 -n coder -- psql -U postgres -c "\l"
kubectl exec -it coder-db-1 -n coder -- psql -U postgres -c "\du"
Test connection string:
kubectl exec -it coder-db-1 -n coder -- psql "$(kubectl get secret coder-db-user -n coder -o jsonpath='{.data.uri}' | base64 -d)"
Workspace Provisioning Fails
Problem: Workspaces fail to provision from templates
Solution:
Check Coder provisioner logs:
kubectl logs -n coder -l app=coder --tail=100
Verify Kubernetes permissions for workspace creation:
kubectl auth can-i create pods --as=system:serviceaccount:coder:coder -n coder-workspaces
Review template Terraform configuration for errors
Additional Resources
2.2.2.4 - Terralist
Private Terraform Module and Provider Registry with OAuth authentication
Overview
Terralist is an open-source private Terraform registry for modules and providers that implements the HashiCorp registry protocol. As part of the Edge Developer Platform, Terralist enables teams to securely store, version, and distribute internal Terraform modules and providers with built-in authentication and documentation capabilities.
The Terralist stack deploys a self-hosted instance with OAuth2 authentication, persistent storage, and integrated ingress for secure access.
Key Features
- Private Module Registry: Securely host and distribute confidential Terraform modules and providers
- HashiCorp Protocol Compatible: Works seamlessly with
terraform CLI and standard registry workflows - OAuth2 Authentication: Integrated OIDC authentication supporting
terraform login command - Documentation Interface: Web UI to visualize artifacts with automatic module documentation
- Flexible Storage: Supports local storage or remote cloud buckets with presigned URLs
- Git Integration: Works with mono-repositories while leveraging Terraform version attributes
- API Management: RESTful API for programmatic module and provider management
Repository
Code: Terralist Stack Templates
Documentation:
Getting Started
Prerequisites
- Kubernetes cluster with ArgoCD installed (provided by
core stack) - Ingress controller configured (provided by
otc stack) - cert-manager for TLS certificate management (provided by
otc stack) - Domain name configured via
DOMAIN_GITEA environment variable - OAuth2 provider configured (Dex or external provider)
Quick Start
The Terralist stack is deployed as part of the EDP installation process:
Trigger Deploy Pipeline
- Go to Infra Deploy Pipeline
- Click on Run workflow
- Enter a name in “Select environment directory to deploy”. This must be DNS Compatible. (if you enter
test-me then the domain will be terralist.test-me.t09.de) - Execute workflow
ArgoCD Synchronization
ArgoCD automatically deploys:
- Terralist application (Helm chart v0.8.1)
- Persistent volume for module storage
- Ingress configuration with TLS
- OAuth2 credentials and configuration
Verification
Verify the Terralist deployment:
# Check ArgoCD application status
kubectl get application terralist -n argocd

# Verify Terralist pods are running
kubectl get pods -n terralist

# Check persistent volume claim
kubectl get pvc -n terralist

# Verify ingress configuration
kubectl get ingress -n terralist
Access the Terralist web interface at https://terralist.{DOMAIN_GITEA}.
Architecture
Component Architecture
The Terralist stack consists of:
Terralist Application:
- Web interface for module and provider management
- REST API for programmatic access
- OAuth2 authentication handler
- Module documentation renderer
Storage Layer:
- SQLite database for metadata and configuration
- Local filesystem storage for modules and providers
- Persistent volume with 10Gi capacity on
csi-disk storage class - Optional cloud bucket integration for remote storage
Networking:
- Nginx ingress with TLS termination
- cert-manager integration for automatic certificate management
- OAuth2 callback endpoint configuration
Configuration
Environment Variables
The Terralist application is configured through environment variables in values.yaml:
OAuth2 Configuration:
TERRALIST_AUTHORITY_URL: OIDC provider authority URL (from terralist-oidc-secrets secret)TERRALIST_CLIENT_ID: OAuth2 client identifierTERRALIST_CLIENT_SECRET: OAuth2 client secretTERRALIST_TOKEN_SIGNING_SECRET: Secret for token signing and validation
Storage Configuration:
- SQLite database at
/data/database.db - Module storage at
/data/modules
Helm Chart Configuration
Key Helm values configured in stacks/terralist/terralist/values.yaml:
controllers:
  main:
    strategy: Recreate
    containers:
      main:
        env:
          - name: TERRALIST_AUTHORITY_URL
            valueFrom:
              secretKeyRef:
                name: terralist-oidc-secrets
                key: authority_url
          - name: TERRALIST_CLIENT_ID
            valueFrom:
              secretKeyRef:
                name: terralist-oidc-secrets
                key: client_id

ingress:
  main:
    enabled: true
    className: nginx
    hosts:
      - host: "terralist.{DOMAIN_GITEA}"
        paths:
          - path: /
            service:
              identifier: main
    annotations:
      cert-manager.io/cluster-issuer: main
    tls:
      - secretName: terralist-tls-secret
        hosts:
          - "terralist.{DOMAIN_GITEA}"

persistence:
  data:
    enabled: true
    size: 10Gi
    storageClass: csi-disk
    accessMode: ReadWriteOnce
ArgoCD Application Configuration
Registry Application (template/registry/terralist.yaml):
- Name:
terralist-reg - Manages the Terralist stack directory
- Automated sync with prune and self-heal enabled
Stack Application (template/stacks/terralist/terralist.yaml):
- Name:
terralist - Deploys Terralist Helm chart v0.8.1 from
https://github.com/terralist/helm-charts - Automated self-healing enabled
- Creates namespace automatically
- References values from
stacks-instances repository
Usage Examples
Authenticating with Terralist
Configure Terraform CLI to use your private registry:
# Authenticate using OAuth2
terraform login terralist.${DOMAIN_GITEA}

# This opens a browser window for OAuth2 authentication
# After successful login, credentials are stored in ~/.terraform.d/credentials.tfrc.json
Publishing a Module
Publish a module to your private registry:
Create Module Structure
my-module/
├── main.tf
├── variables.tf
├── outputs.tf
└── README.md
Tag and Push via API
# Package module
tar -czf my-module-1.0.0.tar.gz my-module/

# Upload to Terralist (requires authentication token)
curl -X POST https://terralist.${DOMAIN_GITEA}/v1/modules/my-org/my-module/my-provider/1.0.0 \
  -H "Authorization: Bearer ${TERRALIST_TOKEN}" \
  -F "file=@my-module-1.0.0.tar.gz"
Consuming Private Modules
Use modules from your private registry in Terraform configurations:
# Configure Terraform to use private registry
terraform {
  required_providers {
    aws = {
      source  = "hashicorp/aws"
      version = "~> 5.0"
    }
  }
}

# Reference module from private registry
module "vpc" {
  source  = "terralist.${DOMAIN_GITEA}/my-org/vpc/aws"
  version = "1.0.0"

  cidr_block = "10.0.0.0/16"
  environment = "production"
}
Browsing Module Documentation
Access the Terralist web interface to view module documentation:
# Open Terralist UI
open https://terralist.${DOMAIN_GITEA}

# Browse available modules
# - View module versions
# - Read generated documentation
# - Access module sources
# - Copy usage examples
Managing Modules via API
# List all modules
curl -H "Authorization: Bearer ${TERRALIST_TOKEN}" \
  https://terralist.${DOMAIN_GITEA}/v1/modules

# Get specific module versions
curl -H "Authorization: Bearer ${TERRALIST_TOKEN}" \
  https://terralist.${DOMAIN_GITEA}/v1/modules/my-org/my-module/my-provider

# Delete a module version
curl -X DELETE -H "Authorization: Bearer ${TERRALIST_TOKEN}" \
  https://terralist.${DOMAIN_GITEA}/v1/modules/my-org/my-module/my-provider/1.0.0
Integration Points
- Core Stack: Depends on ArgoCD for deployment orchestration
- OTC Stack: Requires ingress-nginx controller and cert-manager for external access and TLS
- Dex (SSO): Integrates with platform OAuth2 provider for authentication
- Forgejo Stack: Modules can be sourced from platform Git repositories
- Observability Stack: Application metrics can be collected by platform monitoring tools
Troubleshooting
Terralist Pod Not Starting
Problem: Terralist pod remains in Pending or CrashLoopBackOff state
Solution:
Check persistent volume claim status:
kubectl get pvc -n terralist
kubectl describe pvc data-terralist-0 -n terralist
Verify OAuth2 credentials secret:
kubectl get secret terralist-oidc-secrets -n terralist
kubectl describe secret terralist-oidc-secrets -n terralist
Check Terralist logs:
kubectl logs -n terralist -l app.kubernetes.io/name=terralist
Cannot Access Terralist UI
Problem: Terralist web interface is not accessible at configured URL
Solution:
Verify ingress configuration:
kubectl get ingress -n terralist
kubectl describe ingress -n terralist
Check TLS certificate status:
kubectl get certificate -n terralist
kubectl describe certificate terralist-tls-secret -n terralist
Verify DNS resolution:
nslookup terralist.${DOMAIN_GITEA}
OAuth2 Authentication Fails
Problem: terraform login or web authentication fails
Solution:
Verify OAuth2 configuration in secret:
kubectl get secret terralist-oidc-secrets -n terralist -o yaml
Check OAuth2 provider (Dex) is accessible:
curl https://dex.${DOMAIN_GITEA}/.well-known/openid-configuration
Verify callback URL is correctly configured in OAuth2 provider:
Expected callback: https://terralist.${DOMAIN_GITEA}/auth/cli/callback
Check Terralist logs for authentication errors:
kubectl logs -n terralist -l app.kubernetes.io/name=terralist | grep -i auth
Module Upload Fails
Problem: Cannot upload modules via API or UI
Solution:
Verify authentication token is valid:
# Test token with API call
curl -H "Authorization: Bearer ${TERRALIST_TOKEN}" \
  https://terralist.${DOMAIN_GITEA}/v1/modules
Check persistent volume has available space:
kubectl exec -n terralist -it terralist-0 -- df -h /data
Verify module package format is correct:
# Module should be a gzipped tar archive
tar -tzf my-module-1.0.0.tar.gz
Review upload logs:
kubectl logs -n terralist -l app.kubernetes.io/name=terralist --tail=50
Problem: terraform init fails to download modules from private registry
Solution:
Verify authentication credentials exist:
cat ~/.terraform.d/credentials.tfrc.json
Re-authenticate if needed:
terraform logout terralist.${DOMAIN_GITEA}
terraform login terralist.${DOMAIN_GITEA}
Test module availability via API:
curl -H "Authorization: Bearer ${TERRALIST_TOKEN}" \
  https://terralist.${DOMAIN_GITEA}/v1/modules/my-org/my-module/my-provider
Check module source URL format in Terraform configuration:
# Correct format
source = "terralist.${DOMAIN_GITEA}/org/module/provider"

# Not: https://terralist.${DOMAIN_GITEA}/...
Additional Resources
2.2.2.5 - Forgejo
Self-hosted Git service with built-in CI/CD capabilities
Overview
Forgejo is a self-hosted Git service that provides repository hosting, code collaboration, and integrated CI/CD workflows. As part of the Edge Developer Platform, Forgejo serves as the central code repository and continuous integration system, offering a complete DevOps platform with Git hosting, issue tracking, and automated build pipelines.
The Forgejo stack deploys a Forgejo server instance with PostgreSQL database backend, MinIO object storage, and Forgejo Runners for executing CI/CD workflows.
Key Features
- Git Repository Hosting: Full-featured Git server with web interface for code management
- Built-in CI/CD: Forgejo Actions provide GitHub Actions-compatible workflow automation
- Issue Tracking: Integrated project management with issues, milestones, and pull requests
- Container Registry: Built-in Docker registry for container image storage
- Code Review: Pull request workflows with inline comments and approval processes
- Scalable Runners: Distributed runner architecture with Docker-in-Docker execution
- S3 Object Storage: MinIO integration for artifacts, LFS objects, and backups
Repository
Code: Forgejo Stack Templates
Documentation:
Getting Started
Prerequisites
- Kubernetes cluster with ArgoCD installed (provided by
core stack) - CloudNativePG operator (provided by
core stack) - Ingress controller configured (provided by
otc stack) - cert-manager for TLS certificate management (provided by
otc stack) - Infrastructure deployed through Infra Deploy
Quick Start
The Forgejo stack is deployed as part of the EDP installation process:
Trigger Deploy Pipeline
- Go to Infra Deploy Pipeline
- Click on Run workflow
- Enter a name in “Select environment directory to deploy”. This must be DNS Compatible. (if you enter
test-me then the domain will be forgejo.test-me.t09.de) - Execute workflow
ArgoCD Synchronization
ArgoCD automatically deploys:
- Forgejo server (Helm chart v16.2.0)
- PostgreSQL database cluster (CloudNativePG)
- Forgejo Runners with Docker-in-Docker execution
- Ingress configuration with TLS
- Database credentials and storage secrets
Verification
Verify the Forgejo deployment:
# Check ArgoCD applications status
kubectl get application forgejo-server -n argocd
kubectl get application forgejo-runner -n argocd

# Verify Forgejo server pods are running
kubectl get pods -n gitea

# Check PostgreSQL cluster status
kubectl get cluster -n gitea

# Verify Forgejo runners are active
kubectl get pods -n gitea -l app=forgejo-runner

# Verify ingress configuration
kubectl get ingress -n gitea
Access the Forgejo web interface at https://{DOMAIN_GITEA}.
Architecture
Component Architecture
The Forgejo stack consists of:
Forgejo Server:
- Web application for Git repository management
- API server for Git operations and CI/CD orchestration
- Issue tracker and project management interface
- Container registry for Docker images
- Artifact storage via MinIO object storage
Forgejo Runners:
- 3-replica runner deployment for parallel job execution
- Docker-in-Docker (DinD) architecture for containerized builds
- Runner image:
code.forgejo.org/forgejo/runner:12.6.4 - Build container:
docker:28.0.4-dind - Supports GitHub Actions-compatible workflows
Storage Architecture:
- 200Gi persistent volume for Git repositories (GPSSD storage)
- OTC S3 object storage for LFS objects and artifacts
- Encrypted volumes using KMS key integration
- S3-compatible backup storage (100GB)
Networking:
- SSH LoadBalancer service on port 32222 for Git operations
- HTTPS ingress with TLS termination for web interface
- Internal service communication via ClusterIP
Configuration
Forgejo Server Configuration
The Forgejo server is configured through Helm values in stacks/forgejo/forgejo-server/values.yaml:
Application Settings:
FORGEJO_IMAGE_TAG: Forgejo container image version- Application name: “EDP”
- Slogan: “Build your thing in minutes”
- User registration: Disabled by default
- Email notifications: Enabled
Storage Configuration:
persistence:
  size: 200Gi
  storageClass: csi-disk
  annotations:
    everest.io/crypt-key-id: "{KMS_KEY_ID}"
    everest.io/disk-volume-type: GPSSD
Database Configuration:
Database credentials are sourced from Kubernetes secrets:
POSTGRES_HOST: PostgreSQL hostnamePOSTGRES_DB: Database namePOSTGRES_USER: Database usernamePOSTGRES_PASSWORD: Database password- SSL verification enabled
Object Storage:
- Endpoint:
obs.eu-de.otc.t-systems.com - Credentials from
gitea/forgejo-cloud-credentials secret - Used for artifacts, LFS objects, and backups
External Services:
- Redis for caching and session management
- Elasticsearch for issue indexing
- SMTP for email notifications
SSH Configuration:
service:
  ssh:
    type: LoadBalancer
    port: 32222
Forgejo Runner Configuration
Defined in stacks/forgejo/forgejo-runner/dind-docker.yaml:
Deployment Specification:
- 3 replicas for parallel execution
- Runner version: 6.4.0
- Docker DinD version: 28.0.4
Runner Registration:
- Offline registration using secret token
- Instance URL from configuration
- Predefined labels for Ubuntu 22.04 and latest
Container Configuration:
runner:
  image: code.forgejo.org/forgejo/runner:12.6.4
  privileged: true
  securityContext:
    runAsUser: 0
    allowPrivilegeEscalation: true

dind:
  image: docker:28.0.4-dind
  privileged: true
  tlsCertDir: /certs
Volume Management:
- Docker certificates volume for TLS communication
- Runner data volume for registration and configuration
- Shared socket for container communication
ArgoCD Application Configuration
Server Application (template/stacks/forgejo/forgejo-server.yaml):
- Name:
forgejo-server - Namespace:
gitea - Helm chart v12.0.0 from
https://code.forgejo.org/forgejo-helm/forgejo-helm.git - Automated self-healing enabled
- Values from
stacks-instances repository
Runner Application (template/stacks/forgejo/forgejo-runner.yaml):
- Name:
forgejo-runner - Namespace:
argocd - Deployment manifests from
stacks-instances repository - Automated sync with unlimited retries
Usage Examples
Creating Your First Repository
After deployment, create and use Git repositories:
Access Forgejo Interface
open https://${DOMAIN_GITEA}
Create a New Repository
- Click “+” icon in top right
- Select “New Repository”
- Enter repository name and description
- Choose visibility (public/private)
- Initialize with README if desired
Clone and Push Code
# Clone the repository
git clone https://${DOMAIN_GITEA}/myorg/myrepo.git
cd myrepo

# Add your code
echo "# My Project" > README.md
git add README.md
git commit -m "Initial commit"

# Push to Forgejo
git push origin main
Setting Up CI/CD with Forgejo Actions
Create automated workflows using Forgejo Actions:
Create Workflow File
mkdir -p .forgejo/workflows
cat > .forgejo/workflows/build.yaml << 'EOF'
name: Build and Test

on:
  push:
    branches: [main]
  pull_request:
    branches: [main]

jobs:
  build:
    runs-on: ubuntu-22.04
    steps:
      - name: Checkout code
        uses: actions/checkout@v4

      - name: Set up Go
        uses: actions/setup-go@v4
        with:
          go-version: '1.21'

      - name: Build
        run: go build -v ./...

      - name: Test
        run: go test -v ./...
EOF
Commit and Push Workflow
git add .forgejo/workflows/build.yaml
git commit -m "Add CI/CD workflow"
git push origin main
Monitor Workflow Execution
- Navigate to repository in Forgejo web interface
- Click “Actions” tab
- View workflow runs and logs
Building and Publishing Container Images
Use Forgejo to build and store Docker images:
# .forgejo/workflows/docker.yaml
name: Build Container Image

on:
  push:
    tags: ['v*']

jobs:
  build:
    runs-on: ubuntu-22.04
    steps:
      - name: Checkout
        uses: actions/checkout@v4

      - name: Build image
        run: |
          docker build -t forgejo.${DOMAIN_GITEA}/myorg/myapp:${GITHUB_REF_NAME} .

      - name: Login to registry
        run: |
          echo "${{ secrets.REGISTRY_PASSWORD }}" | \
          docker login forgejo.${DOMAIN_GITEA} -u "${{ secrets.REGISTRY_USER }}" --password-stdin

      - name: Push image
        run: |
          docker push forgejo.${DOMAIN_GITEA}/myorg/myapp:${GITHUB_REF_NAME}
Using SSH for Git Operations
Configure SSH access for Git operations:
# Generate SSH key if needed
ssh-keygen -t ed25519 -C "your_email@example.com"

# Add public key to Forgejo
# Navigate to: Settings -> SSH / GPG Keys -> Add Key

# Configure SSH host
cat >> ~/.ssh/config << EOF
Host forgejo.${DOMAIN_GITEA}
  Port 32222
  User git
EOF

# Clone repository via SSH
git clone ssh://git@forgejo.${DOMAIN_GITEA}:32222/myorg/myrepo.git
Integration Points
- Core Stack: Depends on ArgoCD for deployment orchestration and CloudNativePG operator for database management
- OTC Stack: Requires ingress-nginx controller and cert-manager for external access and TLS
- Coder Stack: Development workspaces can clone repositories and trigger CI/CD workflows
- Observability Stack: Prometheus metrics collection enabled via ServiceMonitor
- Dex (SSO): Can be configured for centralized authentication integration
Troubleshooting
Forgejo Server Not Starting
Problem: Forgejo server pods remain in Pending or CrashLoopBackOff state
Solution:
Check PostgreSQL cluster status:
kubectl get cluster -n gitea
kubectl describe cluster -n gitea
Verify database credentials:
kubectl get secret -n gitea | grep postgres
Check Forgejo server logs:
kubectl logs -n gitea -l app=forgejo
Verify MinIO connectivity:
kubectl get secret minio-credential -n gitea
kubectl logs -n gitea -l app=forgejo | grep -i minio
Cannot Access Forgejo Web Interface
Problem: Forgejo web interface is not accessible at configured URL
Solution:
Verify ingress configuration:
kubectl get ingress -n gitea
kubectl describe ingress -n gitea
Check TLS certificate status:
kubectl get certificate -n gitea
kubectl describe certificate -n gitea
Verify DNS resolution:
nslookup forgejo.${DOMAIN_GITEA}
Test service connectivity:
kubectl port-forward -n gitea svc/forgejo-http 3000:3000
curl http://localhost:3000
Git Operations Fail Over SSH
Problem: Cannot clone or push repositories via SSH
Solution:
Verify SSH service is exposed:
kubectl get svc -n gitea -l app=forgejo
Check LoadBalancer external IP:
kubectl get svc -n gitea forgejo-ssh -o wide
Test SSH connectivity:
ssh -T -p 32222 git@${DOMAIN_GITEA}
Verify SSH public key is added to Forgejo account
Forgejo Runners Not Executing Jobs
Problem: CI/CD workflows remain queued or fail to execute
Solution:
Check runner pod status:
kubectl get pods -n gitea -l app=forgejo-runner
kubectl logs -n gitea -l app=forgejo-runner
Verify runner registration:
kubectl exec -n gitea -it deployment/forgejo-runner -- \
  forgejo-runner status
Check Docker-in-Docker daemon:
kubectl logs -n gitea -l app=forgejo-runner -c dind
Verify runner token secret exists:
kubectl get secret -n gitea | grep runner
Check Forgejo server can communicate with runners:
kubectl logs -n gitea -l app=forgejo | grep -i runner
Database Connection Errors
Problem: Forgejo cannot connect to PostgreSQL database
Solution:
Verify PostgreSQL cluster health:
kubectl get pods -n gitea -l cnpg.io/cluster
kubectl logs -n gitea -l cnpg.io/cluster
Test database connection:
kubectl exec -n gitea -it <postgres-pod> -- \
  psql -U postgres -c "\l"
Verify database credentials secret:
kubectl get secret -n gitea -o yaml | grep POSTGRES
Check database connection from Forgejo pod:
kubectl exec -n gitea -it <forgejo-pod> -- \
  nc -zv <postgres-host> 5432
Storage Issues
Problem: Repository pushes fail or object storage errors occur
Solution:
Check PVC status and capacity:
kubectl get pvc -n gitea
kubectl describe pvc -n gitea
Verify MinIO credentials and connectivity:
kubectl get secret minio-credential -n gitea
kubectl logs -n gitea -l app=forgejo | grep -i "s3\|minio"
Check available storage space:
kubectl exec -n gitea -it <forgejo-pod> -- df -h
Review storage class configuration:
kubectl get storageclass csi-disk -o yaml
Additional Resources
2.2.2.6 - Observability
Comprehensive monitoring, metrics, and logging for Kubernetes infrastructure
Overview
The Observability stack provides enterprise-grade monitoring, metrics collection, and logging capabilities for the Edge Developer Platform. Built on VictoriaMetrics and Grafana, it offers a complete observability solution with pre-configured dashboards, alerting, and SSO integration.
The stack deploys VictoriaMetrics for metrics storage and querying, Grafana for visualization, VictoriaLogs for log aggregation, and VMAuth for authenticated access to monitoring endpoints.
Key Features
- Metrics Collection: VictoriaMetrics-based Kubernetes monitoring with long-term storage
- Visualization: Grafana with pre-built dashboards for ArgoCD, Ingress-Nginx, and infrastructure components
- Log Aggregation: VictoriaLogs for centralized logging with Grafana integration
- SSO Integration: OAuth authentication through Dex with role-based access control
- Alerting: Alertmanager with email notifications for critical events
- Secure Access: TLS-enabled ingress with authentication proxy (VMAuth)
- Persistent Storage: Encrypted volumes with configurable retention policies
Repository
Code: Observability Stack Templates
Documentation:
Getting Started
Prerequisites
- Kubernetes cluster with ArgoCD installed (provided by
core stack) - Ingress controller configured (provided by
otc stack) - cert-manager for TLS certificate management (provided by
otc stack) - Dex SSO provider (provided by
core stack) - Infrastructure deployed through Infra Deploy
Quick Start
The Observability stack is deployed as part of the EDP installation process:
Trigger Deploy Pipeline
- Go to Infra Deploy Pipeline
- Click on Run workflow
- Enter a name in “Select environment directory to deploy”. This must be DNS Compatible. (if you enter
test-me then domains will be vmauth.test-me.t09.de and grafana.test-me.t09.de) - Execute workflow
ArgoCD Synchronization
ArgoCD automatically deploys:
- VictoriaMetrics Operator and components
- VictoriaMetrics Single (metrics storage)
- VMAuth (authentication proxy)
- Alertmanager (alerting)
- Grafana Operator
- Grafana instance with OAuth
- VictoriaLogs datasource
- Pre-configured dashboards
- Ingress configurations with TLS
Verification
Verify the Observability deployment:
# Check ArgoCD applications status
kubectl get application grafana-operator -n argocd
kubectl get application victoria-k8s-stack -n argocd

# Verify VictoriaMetrics components are running
kubectl get pods -n observability

# Check Grafana instance status
kubectl get grafana grafana -n observability

# Verify ingress configurations
kubectl get ingress -n observability
Access the monitoring interfaces:
- Grafana:
https://grafana.{DOMAIN_O12Y}
Architecture
Component Architecture
The Observability stack consists of multiple integrated components:
VictoriaMetrics Components:
- VictoriaMetrics Operator: Manages VictoriaMetrics custom resources
- VictoriaMetrics Single: Standalone metrics storage with 20Gi storage and 1-month retention
- VMAgent: Scrapes metrics from Kubernetes components (kubelet, CoreDNS, kube-apiserver, etcd)
- VMAuth: Authentication proxy on port 8427 for secure metrics access
- VMAlertmanager: Handles alert routing and notifications
Grafana Components:
- Grafana Operator: Manages Grafana instances and dashboards as Kubernetes resources
- Grafana Instance: Web application for metrics visualization with OAuth authentication
- Pre-configured Dashboards: ArgoCD, Ingress-Nginx, VictoriaLogs monitoring
Logging:
- VictoriaLogs: Log aggregation service integrated as Grafana datasource
Storage:
- VictoriaMetrics Single: 20Gi persistent storage on
csi-disk storage class - Grafana: 10Gi persistent storage on
csi-disk storage class with KMS encryption - Configurable retention: 1 month for metrics, minimum 24 hours enforced
Networking:
- Nginx ingress with TLS termination for Grafana and VMAuth
- cert-manager integration for automatic certificate management
- Internal ClusterIP services for component communication
Configuration
VictoriaMetrics Configuration
Key configuration in stacks/observability/victoria-k8s-stack/values.yaml:
Operator Settings:
victoria-metrics-operator:
  enabled: true
  operator:
    enable_converter_ownership: true
  admissionWebhooks:
    certManager:
      enabled: true
      issuer:
        name: main
Storage Configuration:
vmsingle:
  enabled: true
  spec:
    retentionPeriod: "1"
    storage:
      storageClassName: csi-disk
      resources:
        requests:
          storage: 20Gi
VMAuth Configuration:
vmauth:
  enabled: true
  spec:
    port: "8427"
  ingress:
    enabled: true
    ingressClassName: nginx
    hosts:
      - name: "{{{ .Env.DOMAIN_O12Y }}}"
    tls:
      - secretName: vmauth-tls-secret
        hosts:
          - "{{{ .Env.DOMAIN_O12Y }}}"
    annotations:
      cert-manager.io/cluster-issuer: main
Monitoring Targets:
- Kubelet (cadvisor, probes, resources metrics)
- CoreDNS
- etcd
- kube-apiserver
Disabled Collectors (to avoid alerts on managed clusters):
- kube-controller-manager
- kube-scheduler
- kube-proxy
Alertmanager Configuration
Email alerting configured in values.yaml:
alertmanager:
  spec:
    externalURL: "https://{{{ .Env.DOMAIN_O12Y }}}"
    configSecret: vmalertmanager-config
  config:
    route:
      routes:
        - matchers:
            - severity =~ "critical|major"
          receiver: mail
    receivers:
      - name: 'mail'
        email_configs:
          - to: 'alerts@example.com'
            from: 'monitoring@example.com'
            smarthost: 'mail.mms-support.de:465'
            auth_username:
              name: email-user-credentials
              key: username
            auth_password:
              name: email-user-credentials
              key: password
Grafana Configuration
Grafana instance configuration in stacks/observability/grafana-operator/manifests/grafana.yaml:
OAuth/SSO Integration:
config:
  auth.generic_oauth:
    enabled: "true"
    disable_login_form: "true"
    client_id: "$__env{GF_AUTH_GENERIC_OAUTH_CLIENT_ID}"
    client_secret: "$__env{GF_AUTH_GENERIC_OAUTH_CLIENT_SECRET}"
    scopes: "openid email profile offline_access groups"
    auth_url: "https://dex.{DOMAIN}/auth"
    token_url: "https://dex.{DOMAIN}/token"
    api_url: "https://dex.{DOMAIN}/userinfo"
    role_attribute_path: "contains(groups[*], 'DevFW') && 'Admin' || 'Viewer'"
Storage:
deployment:
  spec:
    template:
      spec:
        volumes:
          - name: grafana-data
            persistentVolumeClaim:
              claimName: grafana-pvc

persistentVolumeClaim:
  spec:
    storageClassName: csi-disk
    accessModes:
      - ReadWriteOnce
    resources:
      requests:
        storage: 10Gi
Ingress:
ingress:
  spec:
    ingressClassName: nginx
    rules:
      - host: "{{{ .Env.DOMAIN_GRAFANA }}}"
        http:
          paths:
            - path: /
              pathType: Prefix
              backend:
                service:
                  name: grafana-service
                  port:
                    number: 3000
    tls:
      - hosts:
          - "{{{ .Env.DOMAIN_GRAFANA }}}"
        secretName: grafana-tls-secret
ArgoCD Application Configuration
Grafana Operator Application (template/stacks/observability/grafana-operator.yaml):
- Name:
grafana-operator - Chart:
grafana-operator v5.18.0 from ghcr.io/grafana/helm-charts - Automated sync with self-healing enabled
- Namespace:
observability
VictoriaMetrics Stack Application (template/stacks/observability/victoria-k8s-stack.yaml):
- Name:
victoria-k8s-stack - Chart:
victoria-metrics-k8s-stack v0.48.1 from https://victoriametrics.github.io/helm-charts/ - Automated self-healing enabled
- Creates namespace automatically
Usage Examples
Accessing Grafana
Access Grafana through SSO:
Navigate to Grafana
open https://grafana.${DOMAIN_GRAFANA}
Authenticate via Dex
- Click “Sign in with OAuth”
- Authenticate through configured identity provider
- Users in
DevFW group receive Admin role, others receive Viewer role
Querying Metrics
Query VictoriaMetrics directly:
# Access VMAuth endpoint
curl -u username:password https://vmauth.${DOMAIN_O12Y}/api/v1/query \
  -d 'query=up' | jq

# Query pod CPU usage
curl -u username:password https://vmauth.${DOMAIN_O12Y}/api/v1/query \
  -d 'query=container_cpu_usage_seconds_total' | jq

# Query with time range
curl -u username:password https://vmauth.${DOMAIN_O12Y}/api/v1/query_range \
  -d 'query=container_memory_usage_bytes' \
  -d 'start=2024-01-01T00:00:00Z' \
  -d 'end=2024-01-01T23:59:59Z' \
  -d 'step=5m' | jq
Creating Custom Dashboards
Create custom Grafana dashboards as Kubernetes resources:
apiVersion: grafana.integreatly.org/v1beta1
kind: GrafanaDashboard
metadata:
  name: custom-app-dashboard
  namespace: observability
spec:
  instanceSelector:
    matchLabels:
      dashboards: "grafana"
  json: |
    {
      "dashboard": {
        "title": "Custom Application Metrics",
        "panels": [
          {
            "title": "Request Rate",
            "targets": [
              {
                "expr": "rate(http_requests_total[5m])",
                "datasource": "VictoriaMetrics"
              }
            ]
          }
        ]
      }
    }
Apply the dashboard:
kubectl apply -f custom-dashboard.yaml
Viewing Logs in Grafana
Access VictoriaLogs through Grafana:
- Navigate to Grafana
https://grafana.${DOMAIN_GRAFANA} - Go to Explore
- Select “VictoriaLogs” datasource
- Use LogQL queries:
{namespace="default"}
{app="nginx"} |= "error"
{namespace="observability"} | json | level="error"
Setting Up Custom Alerts
Create custom alert rules using VMRule:
apiVersion: operator.victoriametrics.com/v1beta1
kind: VMRule
metadata:
  name: custom-app-alerts
  namespace: observability
spec:
  groups:
    - name: custom-app
      interval: 30s
      rules:
        - alert: HighErrorRate
          expr: rate(http_requests_total{status=~"5.."}[5m]) > 0.05
          for: 5m
          labels:
            severity: critical
          annotations:
            summary: "High error rate detected"
            description: "Error rate is {{ $value }} requests/sec"
Push the alert rule to stacks instances
Integration Points
- Core Stack: Depends on ArgoCD for deployment orchestration
- OTC Stack: Requires ingress-nginx controller and cert-manager for external access and TLS
- Dex (SSO): Integrated for Grafana authentication with role-based access control
- All Platform Services: Automatically collects metrics from Kubernetes components and platform services
- Application Stacks: Provides monitoring for Coder, Forgejo, and other deployed services
Troubleshooting
VictoriaMetrics Pods Not Starting
Problem: VictoriaMetrics components remain in Pending or CrashLoopBackOff state
Solution:
Check VictoriaMetrics resources:
kubectl get vmsingle,vmagent,vmalertmanager -n observability
kubectl describe vmsingle vmsingle -n observability
Verify persistent volume claims:
kubectl get pvc -n observability
kubectl describe pvc vmstorage-vmsingle-0 -n observability
Check operator logs:
kubectl logs -n observability -l app.kubernetes.io/name=victoria-metrics-operator
Grafana Not Accessible
Problem: Grafana web interface is not accessible at configured URL
Solution:
Verify Grafana instance status:
kubectl get grafana grafana -n observability
kubectl describe grafana grafana -n observability
Check Grafana pod logs:
kubectl logs -n observability -l app=grafana
Verify ingress configuration:
kubectl get ingress -n observability
kubectl describe ingress grafana-ingress -n observability
Check TLS certificate status:
kubectl get certificate -n observability
kubectl describe certificate grafana-tls-secret -n observability
OAuth Authentication Failing
Problem: Cannot authenticate to Grafana via SSO
Solution:
Verify Dex is running:
kubectl get pods -n core -l app=dex
kubectl logs -n core -l app=dex
Check OAuth client secret:
kubectl get secret dex-grafana-client -n observability
kubectl describe secret dex-grafana-client -n observability
Review Grafana OAuth configuration:
kubectl get grafana grafana -n observability -o yaml | grep -A 20 auth.generic_oauth
Check Grafana logs for OAuth errors:
kubectl logs -n observability -l app=grafana | grep -i oauth
Metrics Not Appearing
Problem: Metrics not showing up in Grafana or VictoriaMetrics
Solution:
Check VMAgent scraping status:
kubectl get vmagent -n observability
kubectl logs -n observability -l app.kubernetes.io/name=vmagent
Verify service monitors are created:
kubectl get vmservicescrape -n observability
kubectl get vmpodscrape -n observability
Check target endpoints:
# Access VMAgent UI (port-forward if needed)
kubectl port-forward -n observability svc/vmagent 8429:8429
open http://localhost:8429/targets
Verify VictoriaMetrics Single is accepting data:
kubectl logs -n observability -l app.kubernetes.io/name=vmsingle
Alerts Not Sending
Problem: Alertmanager not sending email notifications
Solution:
Verify Alertmanager configuration:
kubectl get vmalertmanager -n observability
kubectl describe vmalertmanager vmalertmanager -n observability
Check email credentials secret:
kubectl get secret email-user-credentials -n observability
kubectl describe secret email-user-credentials -n observability
Review Alertmanager logs:
kubectl logs -n observability -l app.kubernetes.io/name=vmalertmanager
Test alert firing manually:
# Access Alertmanager UI
kubectl port-forward -n observability svc/vmalertmanager 9093:9093
open http://localhost:9093
High Storage Usage
Problem: VictoriaMetrics storage running out of space
Solution:
Check current storage usage:
kubectl exec -it -n observability vmsingle-0 -- df -h /storage
Reduce retention period in values.yaml:
vmsingle:
  spec:
    retentionPeriod: "15d"  # Reduce from 1 month
Increase PVC size:
kubectl patch pvc vmstorage-vmsingle-0 -n observability \
  -p '{"spec":{"resources":{"requests":{"storage":"50Gi"}}}}'
Monitor storage metrics in Grafana for capacity planning
Additional Resources
2.2.2.7 - Observability Client
Core observability components for metrics collection, log aggregation, and monitoring
Overview
The Observability Client stack provides essential monitoring and observability infrastructure for Kubernetes environments. As part of the Edge Developer Platform, it deploys client-side components that collect, process, and forward metrics and logs to centralized observability systems.
The stack integrates three core components: Kubernetes Metrics Server for resource metrics, Vector for log collection and forwarding, and Victoria Metrics for comprehensive metrics monitoring and alerting.
Key Features
- Resource Metrics: Real-time CPU and memory metrics via Kubernetes Metrics Server
- Log Aggregation: Unified log collection and forwarding with Vector
- Metrics Monitoring: Comprehensive metrics collection, storage, and alerting with Victoria Metrics
- Prometheus Compatibility: Full Prometheus protocol support for metrics scraping
- Multi-Tenant Support: Configurable tenant isolation for metrics and logs
- Automated Alerting: Pre-configured alert rules with Alertmanager integration
- Grafana Integration: Built-in dashboard provisioning and datasource configuration
Repository
Code: Observability Client Stack Templates
Documentation:
Getting Started
Prerequisites
- Kubernetes cluster with ArgoCD installed (provided by
core stack) - cert-manager for certificate management (provided by
otc stack) - Observability backend services for receiving metrics and logs
Quick Start
The Observability Client stack is deployed as part of the EDP installation process:
Trigger Deploy Pipeline
- Go to Infra Deploy Pipeline
- Click on Run workflow
- Enter a name in “Select environment directory to deploy”. This must be DNS Compatible.
- Execute workflow
ArgoCD Synchronization
ArgoCD automatically deploys:
- Metrics Server (Helm chart v3.12.2)
- Vector agent (Helm chart v0.43.0)
- Victoria Metrics k8s-stack (Helm chart v0.48.1)
- ServiceMonitor resources for Prometheus scraping
- Authentication secrets for remote write endpoints
Verification
Verify the Observability Client deployment:
# Check ArgoCD application status
kubectl get application -n argocd | grep -E "metrics-server|vector|vm-client"

# Verify Metrics Server is running
kubectl get pods -n observability -l app.kubernetes.io/name=metrics-server

# Test metrics API
kubectl top nodes
kubectl top pods -A

# Verify Vector pods are running
kubectl get pods -n observability -l app.kubernetes.io/name=vector

# Check Victoria Metrics components
kubectl get pods -n observability -l app.kubernetes.io/name=victoria-metrics-k8s-stack

# Verify ServiceMonitor resources
kubectl get servicemonitor -n observability
Architecture
Component Architecture
The Observability Client stack consists of three integrated components:
Metrics Server:
- Collects resource metrics (CPU, memory) from kubelet
- Provides Metrics API for kubectl top and HPA
- Lightweight aggregator for cluster-wide resource usage
- Exposes ServiceMonitor for Prometheus scraping
Vector Agent:
- DaemonSet deployment for log collection across all nodes
- Processes and transforms Kubernetes logs
- Forwards logs to centralized Elasticsearch backend
- Injects cluster metadata and environment information
- Supports compression and bulk operations
Victoria Metrics Stack:
- VMAgent: Scrapes metrics from Kubernetes components and applications
- VMAlertmanager: Manages alert routing and notifications
- VMOperator: Manages VictoriaMetrics CRDs and lifecycle
- Integration with remote Victoria Metrics storage
- Supports multi-tenant metrics isolation
Data Flow
Kubernetes Resources → Metrics Server → Metrics API
                                      ↓
                                ServiceMonitor → VMAgent → Remote VictoriaMetrics

Application Logs → Vector Agent → Transform → Remote Elasticsearch

Prometheus Exporters → VMAgent → Remote VictoriaMetrics → VMAlertmanager
Configuration
Metrics Server Configuration
Configured in stacks/observability-client/metrics-server/values.yaml:
metrics:
  enabled: true
serviceMonitor:
  enabled: true
Key Settings:
- Enables metrics collection endpoint
- Exposes ServiceMonitor for Prometheus-compatible scraping
- Deployed via Helm chart from
https://kubernetes-sigs.github.io/metrics-server/
Vector Configuration
Configured in stacks/observability-client/vector/values.yaml:
Role: Agent (DaemonSet deployment across nodes)
Authentication:
Credentials sourced from simple-user-secret:
VECTOR_USER: Username for remote write authenticationVECTOR_PASSWORD: Password for remote write authentication
Data Sources:
k8s: Collects Kubernetes container logsinternal_metrics: Gathers Vector internal metrics
Log Processing:
transforms:
  parser:
    - Parse JSON from log messages
    - Inject cluster environment metadata
    - Remove original message field
Output Sink:
- Elasticsearch bulk API (v8)
- Basic authentication with environment variables
- Gzip compression enabled
- Custom headers: AccountID and ProjectID
Victoria Metrics Stack Configuration
Configured in stacks/observability-client/vm-client-stack/values.yaml:
Operator Settings:
- Enabled with admission webhooks
- Managed by cert-manager for ArgoCD compatibility
VMAgent Configuration:
- Basic authentication for remote write
- Credentials from
vm-remote-write-secret - Stream parsing enabled
- Drop original labels to reduce memory footprint
Monitoring Targets:
- Node exporter for hardware metrics
- kube-state-metrics for Kubernetes object states
- Kubelet metrics (cadvisor)
- Kubernetes control plane components (API server, etcd, scheduler, controller manager)
- CoreDNS metrics
Alertmanager Integration:
- Slack notification templates
- Configurable routing rules
- TLS support for secure communication
Storage Options:
- VMSingle: Single-node deployment
- VMCluster: Distributed deployment with replication
- Configurable retention period
ArgoCD Application Configuration
Metrics Server Application (template/stacks/observability-client/metrics-server.yaml):
- Name:
metrics-server - Chart version: 3.12.2
- Automated sync with self-heal enabled
- Namespace:
observability
Vector Application (template/stacks/observability-client/vector.yaml):
- Name:
vector - Chart version: 0.43.0
- Automated sync with self-heal enabled
- Namespace:
observability
Victoria Metrics Application (template/stacks/observability-client/vm-client-stack.yaml):
- Name:
vm-client - Chart version: 0.48.1
- Automated sync with self-heal enabled
- Namespace:
observability - References manifests from instance repository
Usage Examples
Querying Resource Metrics
Access resource metrics collected by Metrics Server:
# View node resource usage
kubectl top nodes

# View pod resource usage across all namespaces
kubectl top pods -A

# View pod resource usage in specific namespace
kubectl top pods -n observability

# Sort pods by CPU usage
kubectl top pods -A --sort-by=cpu

# Sort pods by memory usage
kubectl top pods -A --sort-by=memory
Using Metrics for Autoscaling
Create Horizontal Pod Autoscaler based on metrics:
apiVersion: autoscaling/v2
kind: HorizontalPodAutoscaler
metadata:
  name: myapp-hpa
spec:
  scaleTargetRef:
    apiVersion: apps/v1
    kind: Deployment
    name: myapp
  minReplicas: 2
  maxReplicas: 10
  metrics:
  - type: Resource
    resource:
      name: cpu
      target:
        type: Utilization
        averageUtilization: 70
Accessing Application Logs
Vector automatically collects logs from all containers. View logs in your centralized Elasticsearch/Kibana:
# Logs are automatically forwarded to Elasticsearch
# Access via Kibana dashboard or Elasticsearch API

# Example: Query logs via Elasticsearch API
curl -u $VECTOR_USER:$VECTOR_PASSWORD \
  -X GET "https://elasticsearch.example.com/_search" \
  -H 'Content-Type: application/json' \
  -d '{
    "query": {
      "match": {
        "kubernetes.namespace": "my-namespace"
      }
    }
  }'
Querying Victoria Metrics
Query metrics collected by Victoria Metrics:
# Access Victoria Metrics query API
# Metrics are forwarded to remote Victoria Metrics instance

# Example PromQL queries:
# - Container CPU usage: container_cpu_usage_seconds_total
# - Pod memory usage: container_memory_usage_bytes
# - Node disk I/O: node_disk_io_time_seconds_total

# Query via Victoria Metrics API
curl -X POST https://victoriametrics.example.com/api/v1/query \
  -d 'query=up' \
  -d 'time=2025-12-16T00:00:00Z'
Creating Custom ServiceMonitors
Expose application metrics for collection:
apiVersion: v1
kind: Service
metadata:
  name: myapp-metrics
  labels:
    app: myapp
spec:
  ports:
  - name: metrics
    port: 8080
    targetPort: 8080
  selector:
    app: myapp
---
apiVersion: monitoring.coreos.com/v1
kind: ServiceMonitor
metadata:
  name: myapp-monitor
  namespace: observability
spec:
  selector:
    matchLabels:
      app: myapp
  endpoints:
  - port: metrics
    path: /metrics
    interval: 30s
Integration Points
- Core Stack: Depends on ArgoCD for deployment orchestration
- OTC Stack: Requires cert-manager for certificate management
- Observability Stack: Forwards metrics and logs to centralized observability backend
- All Application Stacks: Collects metrics and logs from all platform applications
Troubleshooting
Metrics Server Not Responding
Problem: kubectl top commands fail or return no data
Solution:
Check Metrics Server pod status:
kubectl get pods -n observability -l app.kubernetes.io/name=metrics-server
kubectl logs -n observability -l app.kubernetes.io/name=metrics-server
Verify kubelet metrics endpoint:
kubectl get --raw /apis/metrics.k8s.io/v1beta1/nodes
Check ServiceMonitor configuration:
kubectl get servicemonitor -n observability -o yaml
Vector Not Forwarding Logs
Problem: Logs are not appearing in Elasticsearch
Solution:
Check Vector agent status:
kubectl get pods -n observability -l app.kubernetes.io/name=vector
kubectl logs -n observability -l app.kubernetes.io/name=vector --tail=50
Verify authentication secret:
kubectl get secret simple-user-secret -n observability
kubectl get secret simple-user-secret -n observability -o jsonpath='{.data.username}' | base64 -d
Test Elasticsearch connectivity:
kubectl exec -it -n observability $(kubectl get pod -n observability -l app.kubernetes.io/name=vector -o jsonpath='{.items[0].metadata.name}') -- \
  curl -u $VECTOR_USER:$VECTOR_PASSWORD https://elasticsearch.example.com/_cluster/health
Check Vector internal metrics:
kubectl port-forward -n observability svc/vector 9090:9090
curl http://localhost:9090/metrics
Victoria Metrics Not Scraping
Problem: Metrics are not being collected or forwarded
Solution:
Check VMAgent status:
kubectl get pods -n observability -l app.kubernetes.io/name=vmagent
kubectl logs -n observability -l app.kubernetes.io/name=vmagent
Verify remote write secret:
kubectl get secret vm-remote-write-secret -n observability
kubectl get secret vm-remote-write-secret -n observability -o jsonpath='{.data.username}' | base64 -d
Check ServiceMonitor targets:
kubectl get servicemonitor -n observability
kubectl describe servicemonitor metrics-server -n observability
Verify operator is running:
kubectl get pods -n observability -l app.kubernetes.io/name=victoria-metrics-operator
kubectl logs -n observability -l app.kubernetes.io/name=victoria-metrics-operator
High Memory Usage
Problem: Victoria Metrics or Vector consuming excessive memory
Solution:
For Victoria Metrics, verify dropOriginalLabels is enabled:
kubectl get vmagent -n observability -o yaml | grep dropOriginalLabels
Reduce scrape intervals for high-cardinality metrics:
# Edit ServiceMonitor
spec:
endpoints:
- interval: 60s # Increase from 30s
Filter unnecessary logs in Vector:
# Add filter transform to Vector configuration
transforms:
filter:
type: filter
condition: '.kubernetes.namespace != "kube-system"'
Check resource limits:
kubectl describe pod -n observability -l app.kubernetes.io/name=vmagent
kubectl describe pod -n observability -l app.kubernetes.io/name=vector
Certificate Issues
Problem: TLS certificate errors in logs
Solution:
Verify cert-manager is running:
kubectl get pods -n cert-manager
Check certificate status:
kubectl get certificate -n observability
kubectl describe certificate -n observability
Review webhook configuration:
kubectl get validatingwebhookconfigurations | grep victoria-metrics
kubectl get mutatingwebhookconfigurations | grep victoria-metrics
Restart operator if needed:
kubectl rollout restart deployment victoria-metrics-operator -n observability
Additional Resources
2.3 - Deploying to OTC
Open Telekom Cloud as deployment and infrastructure target
Overview
OTC, Open Telekom Cloud, is one of the cloud platform offerings by Deutsche
Telekom and offers GDPR compliant cloud services. The system is based on
OpenStack.
Key Features
- Managed Kubernetes
- Managed services including
- Databases
- RDS PostgreSQL
- ElasticSearch
- S3 compatible storage
- DNS Management
- Backup & Restore of Kubernetes volumes and managed services
Purpose in EDP
OTC is used to host core infrastructure to provide the primary, public EDP
instance and as a test bed for Kubernetes based workloads that would eventually
be deployed to EdgeConnect.
Service components such as Forgejo, Grafana, Garm, and Coder are deployed in OTC
Kubernetes utilizing managed services for databases and storage to reduce the
maintenance and setup burden on the team.
Services and workloads are primarily provisioned using Terraform.
Repository
Code:
Terraform Provider:
Documentation:
OTC Console
Managed Services
EDP instances heavily utilize Open Telekom Cloud’s (OTC) managed services to
simplify operations, enhance reliability, and allow the team to focus on
application development rather than infrastructure management. The core
components of each deployed instance run within the managed Kubernetes service.
The following managed services are integral to EDP deployments:
- Cloud Container Engine (CCE): The managed Kubernetes service that forms
the foundation of each EDP instance, hosting all containerized core components
and workloads.
- Relational Database Service (RDS) for PostgreSQL: Provides scalable and
reliable PostgreSQL database instances, primarily used by applications such as
Forgejo.
- Object Storage Service (OBS): Offers S3-compatible object storage for
storing backups, application data (e.g., for Forgejo), and other static
assets.
- Cloud Search Service (CSS): An optional service providing robust search
capabilities, specifically used for Forgejo’s indexing and search
functionalities.
- Networking: Essential networking components, including Virtual Private
Clouds (VPCs), Load Balancers, and DNS management, which facilitate secure and
efficient communication within the EDP ecosystem.
- Cloud Backup and Recovery (CBR): Vaults are configured to automatically
back up persistent volumes created by CCE instances, ensuring data resilience
and disaster recovery readiness.
2.3.1 - EDP Environments in OTC
Instances of EDP are deployed into distinct OTC environments
Architecture
Two distinct tenants are utilized within OTC to enforce a strict separation
between production (prod) and non-production (non-prod) environments. This
segregation ensures isolated resource management, security policies, and
operational workflows, preventing any potential cross-contamination or impact
between critical production systems and development/testing activities.
- Production Tenant: This tenant is exclusively dedicated to production
workloads and is bound to the primary domain
buildth.ing. All
production-facing EDP instances and associated infrastructure reside within
this tenant, leveraging buildth.ing for public access and service discovery.
Within this tenant, each EDP instance is typically dedicated to a specific
customer. This design decision provides robust data separation, addressing
critical privacy and compliance requirements by isolating customer data. It
also allows for independent upgrade paths and maintenance windows for
individual customer instances, minimizing impact on other customers while
still benefiting from centralized management and deployment strategies. The
primary edp.buildth.ing instance and the observability.buildth.ing
instance are exceptions to this customer-dedicated model, serving foundational
platform roles. - Non-Production Tenant: This tenant hosts all development, testing, and
staging environments, bound to the primary domain
t09.de. This setup allows
for flexible experimentation and robust testing without impacting production
stability.
Each tenant is designed to accommodate multiple instances of the product, EDP.
These instances are dynamically provisioned and typically bound to specific
subdomains, which inherit from their respective primary tenant domain (e.g.,
my-test.t09.de for a non-production instance or customer-a.buildth.ing for a
production instance). This subdomain structure facilitates logical separation
and routing for individual EDP deployments.
2.3.2 - Managing Instances
Managing instances of EDP deployed in OTC
Deployment Strategy
The core of the deployment strategy revolves around the primary production EDP
instance, edp.buildth.ing. This instance acts as a centralized control plane
and code repository, storing all application code, configuration, and deployment
pipelines. It is generally responsible for orchestrating the deployment and
updates of most other EDP instances across both production and non-production
tenants, ensuring consistency and automation.
Circular Dependency Issue
However, a unique circular dependency exists with observability.buildth.ing.
While edp.buildth.ing manages most deployments, it cannot manage its own
lifecycle. Attempting to upgrade edp.buildth.ing itself through its own
mechanisms could lead to critical components becoming unavailable during the
process (e.g., internal container registries going offline), preventing the
system from restarting successfully. To mitigate this, edp.buildth.ing is
instead deployed and managed by observability.buildth.ing, with all its
essential deployment dependencies located within the observability environment.
Crucially, git repositories and other resources like container images are
synchronized from edp.buildth.ing to the observability instance, as
observability.buildth.ing itself does not produce artifacts. In turn,
edp.buildth.ing is responsible for deploying and managing
observability.buildth.ing itself. This creates a carefully managed circular
relationship that ensures both critical components can be deployed and
maintained effectively without single points of failure related to
self-management.
Configuration
This section outlines the processes for deploying and managing the configuration
of EDP instances within the Open Telekom Cloud (OTC) environment. Deployments
are primarily driven by Forgejo Actions and leverage Terraform for
infrastructure provisioning and lifecycle management, adhering to GitOps
principles.
Deployment Workflows
The lifecycle management of EDP instances is orchestrated through a set of
dedicated workflows within the infra-deploy Forgejo
repository, hosted on
edp.buildth.ing. These workflows are designed to emulate the standard
Terraform lifecycle, offering plan, deploy, and destroy operations.
NOTE: When deploying a new instance of EDP it is bootstrapped with random
secrets including admin logins. Initial admin credentials for individual
components are printed in workflow output. They can be retrieved from the
secrets withing Kubernetes at a later point in time.

Configuration Management
The configuration for deployed EDP instances is systematically managed across
several Git repositories to ensure version control, traceability, and adherence
to GitOps practices.
- Base Configuration: A foundational configuration entry for each deployed
system instance is stored directly within the
infra-deploy repository. - Complete System Configuration: The comprehensive configuration for a
system instance, derived from the
stacks template repository, is maintained
in the stacks-instances repository. - GitOps Synchronization: ArgoCD continuously monitors the
stacks-instances repository. It automatically detects and synchronizes any
discrepancies between the desired state defined in Git and the actual state of
the deployed system within the OTC Kubernetes cluster. The configurations in
the stacks-instances repository are organized by OTC tenant and instance
name. ArgoCD monitors only the portion of the repository that is relevant to
its specific instance.
3 - CI Sizer
Resource sizing, energy estimation, and carbon footprint tracking for CI/CD runners.
Overview
CI Sizer is a two-binary Go application that monitors CI/CD runner resource usage and provides right-sizing recommendations, energy consumption estimates, and carbon footprint tracking. It consists of a collector (runs alongside runners, collects metrics from /proc) and a receiver (aggregates data, serves a web dashboard, and provides a REST API). The two components communicate via REST — the collector pushes a run summary to the receiver on shutdown.
CI Sizer reads /proc directly with zero instrumentation — no agent installation or code changes are required in CI jobs.
Supported CI Providers
| Provider | Injection Mechanism | ci_provider value |
|---|
| Forgejo Actions | GARM runner lifecycle | forgejo |
| GitHub Actions | GARM runner lifecycle | github |
| GitLab CI | MutatingAdmissionWebhook | gitlab |
The collector works identically across all providers — it reads /proc and pushes to the receiver. The injection mechanism (how the collector gets into the CI pod) differs per provider.
Key Features
- Multi-provider support — supports Forgejo Actions, GitHub Actions, and GitLab CI via provider-specific injection mechanisms
- Resource monitoring — collects CPU and memory metrics at configurable intervals via
/proc/stat and /proc/<PID>/status - Sizing recommendations — computes Kubernetes resource requests and limits from historical data, with configurable percentiles, buffers, and floors
- Confidence-gated sizing — adapts recommendation aggressiveness through three phases (unknown → learning → confident) based on available data
- OOM detection — detects out-of-memory events via cgroup v2
memory.events and applies exponential backoff recovery - Commit status notifications — posts OOM alerts to Forgejo, GitHub, or GitLab commit status APIs
- Staircase memory buffer — applies decreasing headroom as observed memory grows (20% below 1 GiB, 10% for 1–4 GiB, 5% above 4 GiB)
- Energy estimation — models per-run energy consumption using the Teads SPECpower curve and Cloud Carbon Footprint linear model
- Carbon footprint — calculates gCO2eq per run using real-time FfE hourly emission factors for the German electricity mix, with static and fallback tiers
- Web dashboard — hierarchical drill-down from overview to individual run details, with charts, compare functionality, and keyboard navigation
- OIDC authentication — supports direct OIDC login (Dex, Keycloak, Entra ID) or API gateway JWT forwarding
- Scoped push tokens — HMAC-SHA256 tokens scoped to org/repo/workflow/job; a compromised token cannot read data
- GARM integration — automated runner sizing via WebSocket lifecycle events (Forgejo/GitHub)
- GitLab webhook integration — MutatingAdmissionWebhook for GitLab Runner Kubernetes executor pods
- Container-aware grouping — maps processes to containers via cgroup paths
Architecture
The collector runs as a sidecar in CI pods with shared PID namespace. It samples /proc on a configurable interval, groups processes by container via cgroup paths, and pushes a run summary to the receiver on shutdown (SIGINT/SIGTERM).
The receiver stores metric summaries in SQLite, exposes query and sizing APIs, and serves a web UI at /ui. Internally it is decomposed into focused subpackages: auth/ (OIDC, gateway JWT, middleware), store/ (SQLite persistence), sizing/ (algorithm and overview aggregation), reporting/ (dashboard KPIs and aggregation), garm/ (GARM WebSocket client), pushtoken/ (HMAC token generation), and web/ (embedded static assets and HTML templates).
┌─────────────────────────────────────────────┐ ┌──────────────────────────┐
│ CI/CD Pod (shared PID namespace) │ │ Receiver Service │
│ │ │ │
│ ┌───────────┐ ┌────────┐ ┌───────────┐ │ │ POST /api/v1/metrics │
│ │ collector │ │ runner │ │ sidecar │ │ │ │ │
│ │ │ │ │ │ │ │ push │ ▼ │
│ │ reads │ │ │ │ │ │──────▶│ ┌────────────┐ │
│ │ /proc for │ │ │ │ │ │ │ │ SQLite │ │
│ │ all PIDs │ │ │ │ │ │ │ └────────────┘ │
│ └───────────┘ └────────┘ └───────────┘ │ │ │ │
│ │ │ ▼ │
└─────────────────────────────────────────────┘ │ GET /api/v1/sizing/... │
│ GET /ui │
└──────────────────────────┘
Getting Started
- Review the Configuration reference for all collector and receiver flags
- Deploy the receiver as a central service and the collector as a sidecar in your CI pods
- Generate scoped push tokens for each workflow/job combination
- Access the Web Dashboard at
/ui to explore metrics and sizing recommendations
For Kubernetes deployment examples, see the Configuration page.
Repository
Documentation
| Guide | Description |
|---|
| Configuration | All collector and receiver flags, environment variables, deployment examples |
| Web Dashboard | Using the web UI for resource analysis and sizing recommendations |
| Sizing Algorithm | Algorithm steps, buffers, floors, overrides, enforcement modes |
| OOM Detection | Confidence-gated sizing, OOM recovery, commit status notifications |
| Energy Estimation | Power models, carbon sources, TDP database, and academic references |
| GitLab Integration | MutatingAdmissionWebhook setup for GitLab CI |
| KPI Benchmark | Benchmark methodology and resource optimization results |
| API Reference | All endpoints, authentication, request/response examples |
3.1 - Configuration
Configuration reference for the CI Sizer collector and receiver binaries.
Collector Configuration
The collector runs alongside CI workloads, reads /proc, and pushes a run summary to the receiver on shutdown.
Collector Flags
| Flag | Environment Variable | Description | Default |
|---|
--interval | — | Collection interval (e.g., 5s, 1m) | 5s |
--proc-path | — | Path to proc filesystem | /proc |
--log-level | — | Log level: debug, info, warn, error | info |
--log-format | — | Output format: json, text | json |
--top | — | Number of top processes to include | 5 |
--push-endpoint | — | HTTP endpoint to push metrics to | — |
--push-token | COLLECTOR_PUSH_TOKEN | Bearer token for push endpoint auth | — |
--hardware-profile | RUNNER_HARDWARE_PROFILE | Hardware profile: JSON, preset name, or empty for auto-detect | auto-detect |
--carbon-provider | RUNNER_CARBON_PROVIDER | Carbon intensity provider: energy-charts (default, full 3-tier: Energy Charts → FfE → static), ffe (legacy alias, same chain), static (static table only) | energy-charts |
--carbon-zone | RUNNER_CARBON_ZONE | Carbon intensity zone | DE |
--pue | RUNNER_PUE | Power Usage Effectiveness multiplier | 1.3 |
Carbon Zone
The carbon zone determines which electricity grid is used for carbon intensity estimation.
| Flag | Env | Default | Description |
|---|
--carbon-zone | RUNNER_CARBON_ZONE | DE | ISO 3166-1 alpha-2 country code for the electricity grid zone |
Supported zones:
| Zone | Country | Typical CI (gCO₂eq/kWh) | Notes |
|---|
AT | Austria | ~67 | Hydro-dominated |
BE | Belgium | ~179 | Gas + nuclear mix |
CH | Switzerland | ~42 | Hydro + nuclear |
DE | Germany | ~258 | Mixed (coal/gas/wind/solar) |
DK | Denmark | ~88 | Wind-heavy |
ES | Spain | ~94 | Solar + wind + gas |
FI | Finland | ~59 | Nuclear + hydro + biomass |
FR | France | ~24 | Nuclear-dominated |
IT | Italy | ~206 | Gas-heavy |
NL | Netherlands | ~369 | Gas-dominated |
NO | Norway | ~28 | Hydro-dominated |
PL | Poland | ~505 | Coal-dominated |
SE | Sweden | ~33 | Hydro + nuclear |
Example:
# French grid (nuclear-dominated, very low CI)
./collector --carbon-zone FR
# Or via environment variable
RUNNER_CARBON_ZONE=PL ./collector
Provider chain per zone:
- DE: Energy Charts → FfE blob projection → static (seasonal/weekday)
- All others: Energy Charts → static (seasonal/weekday table with 192 values)
FfE projection data is only available for Germany. For all other zones, the static fallback provides a seasonal/weekday/hourly profile (192 values) when Energy Charts is unavailable.
CI Context Environment Variables
These environment variables identify the CI run context. They are typically set automatically by GitHub Actions / Forgejo Actions.
| Variable | Description | Example |
|---|
GITHUB_REPOSITORY_OWNER | Organization name | my-org |
GITHUB_REPOSITORY | Full repository path | my-org/my-repo |
GITHUB_WORKFLOW | Workflow filename | ci.yml |
GITHUB_JOB | Job name | build |
GITHUB_RUN_ID | Unique run identifier | run-123 |
CGROUP_PROCESS_MAP | JSON: process name to container name | {"node":"runner"} |
CGROUP_LIMITS | JSON: per-container CPU/memory limits | See below |
{
"runner": { "cpu": "2", "memory": "1Gi" },
"sidecar": { "cpu": "500m", "memory": "256Mi" }
}
CPU supports Kubernetes notation ("2" = 2 cores, "500m" = 0.5 cores). Memory supports Ki, Mi, Gi, Ti (binary) or K, M, G, T (decimal).
Note: The collector reads GITHUB_REPOSITORY (e.g., my-org/my-repo) and automatically strips the organization prefix before pushing — the payload’s repository field contains only my-repo. When generating push tokens via POST /api/v1/token, the repository field must use the short name (without the org prefix).
Receiver Configuration
The receiver stores metric summaries, serves the web UI, and provides the sizing and query APIs.
Receiver Flags
| Flag | Environment Variable | Description | Default |
|---|
--addr | — | HTTP listen address | :8080 |
--db | — | SQLite database path | metrics.db |
--read-token | RECEIVER_READ_TOKEN | Pre-shared token for read/admin endpoints | — |
--hmac-key | RECEIVER_HMAC_KEY | Secret key for push token generation/validation | — |
--token-ttl | — | Time-to-live for push tokens | 2h |
--auth-mode | RECEIVER_AUTH_MODE | Authentication mode: none, oidc, gateway | auto-detect |
--cpu-sizing-mode | RECEIVER_CPU_SIZING_MODE | CPU sizing mode: observe or enforce | observe |
--memory-qos | RECEIVER_MEMORY_QOS | Memory QoS class: guaranteed or burstable | guaranteed |
--log-level | RECEIVER_LOG_LEVEL | Log level: debug, info, warn, error | info |
OIDC / Authentication Flags
| Flag | Environment Variable | Description | Default |
|---|
--oidc-issuer | RECEIVER_OIDC_ISSUER | OIDC issuer URL | — |
--oidc-client-id | RECEIVER_OIDC_CLIENT_ID | OIDC client ID | — |
--oidc-client-secret | RECEIVER_OIDC_CLIENT_SECRET | OIDC client secret | — |
--oidc-redirect-uri | RECEIVER_OIDC_REDIRECT_URI | OIDC redirect URI | — |
--session-ttl | — | Session cookie TTL | 12h |
--session-signing-key | RECEIVER_SESSION_SIGNING_KEY | Hex-encoded 32-byte session signing key | auto-generate |
--cookie-secure | RECEIVER_COOKIE_SECURE | Set Secure flag on auth cookies; disable for plain HTTP | true |
--allowed-org | RECEIVER_ALLOWED_ORG | Allowed organization for OIDC login | — |
--logout-url | RECEIVER_LOGOUT_URL | External logout URL for gateway mode | — |
JWT Claim Mapping
| Flag | Environment Variable | Description | Default |
|---|
--claim-sub | RECEIVER_CLAIM_SUB | JWT claim for user ID | sub |
--claim-name | RECEIVER_CLAIM_NAME | JWT claim for display name | name |
--claim-email | RECEIVER_CLAIM_EMAIL | JWT claim for email | email |
--claim-groups | RECEIVER_CLAIM_GROUPS | JWT claim for groups array | groups |
--claim-org | RECEIVER_CLAIM_ORG | JWT claim for organization | org |
--org-from-groups | RECEIVER_ORG_FROM_GROUPS | Org extraction from groups: first, match, none | first |
GARM Integration Flags
| Flag | Environment Variable | Description | Default |
|---|
--garm-url | GARM_URL | GARM base URL for WebSocket event enrichment | — |
--garm-user | GARM_USER | GARM username for JWT authentication | — |
--garm-password | GARM_PASSWORD | GARM password for JWT authentication | — |
--garm-cache-ttl | GARM_CACHE_TTL | TTL for pending GARM event cache | 60s |
OOM Detection & Notification Flags
| Flag | Environment Variable | Description | Default |
|---|
--max-memory | RECEIVER_MAX_MEMORY | Node ceiling for memory (overrides auto-detection from /proc/meminfo) | auto (90% node RAM) |
--max-cpu | RECEIVER_MAX_CPU | Node ceiling for CPU | auto |
--notify-enabled | RECEIVER_NOTIFY_ENABLED | Enable commit status notifications on OOM | false |
--notify-base-url | RECEIVER_NOTIFY_BASE_URL | Forge base URL (auto-detected if unset) | — |
--notify-token | RECEIVER_NOTIFY_TOKEN | API token for forge commit status API | — |
Multi-Provider Flags
| Flag | Environment Variable | Description | Default |
|---|
--ci-provider | CI_PROVIDER | CI provider: forgejo, github, gitlab | forgejo |
GitLab-Specific Variables
These variables are relevant when CI_PROVIDER=gitlab:
| Variable | Description | Default |
|---|
CI_SIZER_RUNNER_NAME | Override runner name (defaults to pod name for GitLab) | pod name |
CGROUP_STRATEGY | Cgroup mapping strategy: default or exclusion | default |
Set CGROUP_STRATEGY=exclusion for GitLab pods where the build container process name is unpredictable. See GitLab Integration for details.
Authentication Modes
CI Sizer supports three authentication modes, configured via --auth-mode:
| Mode | Description |
|---|
none | Token-only authentication. All protected endpoints accept the Bearer read token. |
oidc | Direct OIDC login via Dex, Keycloak, or Entra ID. Most endpoints require an OIDC session cookie; sizing endpoints also accept a Bearer read token for programmatic access. |
gateway | External API gateway (e.g., APISIX) handles authentication and forwards JWTs. All protected endpoints accept the gateway JWT or Bearer read token. |
When --auth-mode is not set, the receiver auto-detects: if --oidc-client-id is provided, it defaults to oidc; otherwise it defaults to none.
Kubernetes Deployment
Receiver Deployment
docker build -f Dockerfile --target receiver -t ci-sizer-receiver:local .
kubectl create namespace ci-sizer
kubectl -n ci-sizer create secret generic receiver-secrets \
--from-literal=read-token=my-secret-token \
--from-literal=hmac-key=my-hmac-key
apiVersion: apps/v1
kind: Deployment
metadata:
name: receiver
spec:
replicas: 1
selector:
matchLabels:
app: receiver
template:
metadata:
labels:
app: receiver
spec:
containers:
- name: receiver
image: ci-sizer-receiver:local
ports:
- containerPort: 8080
env:
- name: RECEIVER_READ_TOKEN
valueFrom:
secretKeyRef:
name: receiver-secrets
key: read-token
- name: RECEIVER_HMAC_KEY
valueFrom:
secretKeyRef:
name: receiver-secrets
key: hmac-key
args: ["--addr=:8080", "--db=/data/metrics.db"]
volumeMounts:
- name: data
mountPath: /data
volumes:
- name: data
emptyDir: {}
For persistent storage, replace the emptyDir volume with a PersistentVolumeClaim.
For plain HTTP deployments (local dev, port-forward), set RECEIVER_COOKIE_SECURE=false to prevent OIDC login failures caused by browsers rejecting Secure cookies over HTTP.
Collector Sidecar
The collector runs as a sidecar in CI pods with shareProcessNamespace: true. Generate a push token first, then deploy:
apiVersion: v1
kind: Pod
metadata:
name: ci-run-test
spec:
shareProcessNamespace: true
restartPolicy: Never
containers:
- name: runner
image: busybox:latest
command: ["/bin/sh", "-c", "while true; do dd if=/dev/zero of=/dev/null bs=1M count=100 2>/dev/null; sleep 1; done"]
resources:
limits:
cpu: "500m"
memory: "256Mi"
- name: collector
image: ci-sizer-collector:local
args: ["--interval=2s", "--top=5", "--push-endpoint=http://receiver.ci-sizer.svc.cluster.local/api/v1/metrics"]
env:
- name: COLLECTOR_PUSH_TOKEN
value: "<PUSH_TOKEN>"
- name: GITHUB_REPOSITORY_OWNER
value: "my-org"
- name: GITHUB_REPOSITORY
value: "my-org/my-repo"
- name: GITHUB_WORKFLOW
value: "ci.yml"
- name: GITHUB_JOB
value: "build"
- name: GITHUB_RUN_ID
value: "test-run-001"
resources:
limits:
cpu: "100m"
memory: "64Mi"
3.2 - Web Dashboard
Using the CI Sizer web dashboard for resource analysis and sizing recommendations.
Overview
The receiver serves an embedded web UI at /ui for exploring runner metrics, sizing recommendations, energy consumption, and carbon footprint data. The dashboard is server-rendered with vanilla JavaScript — no build step or external dependencies are required.
Navigation
The dashboard uses a hierarchical drill-down model with card-based navigation:
- Overview — global KPI summary with per-organization breakdown
- Organization — per-repository summaries within an org
- Repository — per-workflow summaries within a repo
- Workflow/Job — charts showing resource usage, sizing, and energy data across runs
- Run Details — detailed metrics for a single CI run, including sizing recommendations and energy impact
Each level displays entities as clickable cards. Click a card (or press Enter/Space when focused) to drill down to the next level. Use the Backspace key to navigate up one level.
Keyboard Shortcuts
| Key | Action |
|---|
? | Show keyboard shortcuts help |
/ | Focus entity search |
Backspace | Navigate up one level |
Esc | Close modal |
C | Toggle compare basket |
O | Open compare view (when basket has items) |
Cmd+D / Ctrl+D | Toggle dark mode |
Enter / Space | Activate focused card |
Left / Right arrows | Navigate chart data points |
Enter (on chart point) | View details for selected data point |
Charts
At the workflow/job level, the dashboard displays interactive charts for:
- CPU usage — peak and average CPU cores per run
- Memory usage — peak and average memory per run
- Duration — run duration over time
- Success/failure — pass/fail statistics
- Energy consumption — estimated energy (Wh) per run
- Carbon footprint — estimated CO2 emissions (gCO2eq) per run
Charts support a time range selector to filter the displayed period. The x-axis can be toggled between run ID order and chronological time order.
Clicking a data point in any chart navigates to the run details view for that specific execution.
Run Details
The run details view shows comprehensive information for a single CI execution:
- Per-container CPU and memory metrics (peak, average, percentiles)
- Top CPU and memory consuming processes
- Sizing recommendations for each container (request and limit values)
- Energy consumption estimate with methodology and confidence level
- Carbon footprint estimate with carbon intensity source
Compare Feature
The compare feature allows side-by-side comparison of multiple entities (organizations, repositories, workflows, or jobs):
- Press
C to open the compare basket - Add entities to the basket from any navigation level
- Press
O or click the compare button to view a side-by-side comparison - Compare view shows KPIs, resource usage trends, and sizing recommendations across selected entities
Entity Search
Press / to focus the entity search field. Type to filter the visible cards by name. The search works at any navigation level — overview, org, repo, or workflow/job.
3.3 - Sizing Algorithm
How CI Sizer calculates resource sizing recommendations for runners.
Overview
CI Sizer analyses historical resource usage to recommend right-sized Kubernetes resource requests and limits for each container in a CI pod. The goal is to find the smallest allocation that safely completes the job — reducing waste without causing failures.
Methodology
The sizer computes recommendations by aggregating the N most recent clean (non-OOM) runs for a given workflow/job combination. The aggressiveness of the recommendation depends on the current confidence phase.
Confidence Phases
Every workflow/job progresses through three confidence phases as clean samples accumulate:
| Phase | Clean Samples | Behaviour |
|---|
| unknown | 0 | Returns bootstrap default: 4Gi memory, 500m CPU |
| learning | 1–2 | Applies 3× headroom above observed peak (conservative) |
| confident | ≥3 | Full algorithm with tight staircase buffer |
In the confident phase, the full algorithm below applies:
- Collect the N most recent runs (configurable via
?runs= query parameter, 1–100) - Per container, across runs:
- CPU request — take the selected percentile (default: p95) of each run’s CPU usage, then take the maximum across runs
- Memory request — take the peak memory of each run, then take the maximum across runs
- Apply buffers to add headroom above observed values
- Apply floor values to ensure minimum viable allocations
- Apply a memory ceiling — no single container can exceed the total pod memory observed across all runs (plus buffer)
- Round limits to clean values: CPU rounds up to the nearest 0.5 cores; memory rounds up to the next power of 2 in MiB
For full details on confidence phases and OOM recovery, see OOM Detection.
Query Parameters
| Parameter | Default | Description |
|---|
runs | 5 | Number of recent runs to analyse (1–100) |
buffer | 20 | CPU headroom percentage (memory uses the staircase below) |
cpu_percentile | p95 | CPU stat to use: peak, p99, p95, p75, p50, avg |
Thresholds and Floors
Every container receives a minimum viable allocation even if it was completely idle in all observed runs:
| Resource | Request Floor | Limit Floor |
|---|
| CPU | 10m | 500m |
| Memory | 32Mi | 128Mi |
Request and limit floors are intentionally asymmetric: a low request allows efficient scheduling bin-packing, while a higher limit prevents OOM kills or severe throttling if a previously-idle container becomes active.
Staircase Buffer
CPU uses a flat configurable buffer (default: 20%). Memory uses a staircase buffer — larger allocations are inherently more stable and over-provisioning them wastes more cluster resources:
| Observed Peak Memory | Buffer |
|---|
| < 1 GiB | 20% |
| 1 – 4 GiB | 10% |
| > 4 GiB | 5% |
CPU vs Memory Enforcement
Kubernetes treats CPU and memory differently, and the sizer reflects this:
- CPU is compressible — exceeding the limit causes throttling, not failure. The job continues, just slower.
- Memory is incompressible — exceeding the limit triggers an OOM kill. The job fails immediately.
Memory limits are therefore always enforced. CPU enforcement is opt-in via --cpu-sizing-mode:
| Mode | Description |
|---|
observe (default) | Compute CPU recommendations and report them, but mark enforced: false. The provider uses its own defaults. |
enforce | Apply CPU recommendations as Kubernetes requests/limits (enforced: true). |
Memory QoS
The --memory-qos flag controls the memory QoS class:
| Mode | Description |
|---|
guaranteed (default) | Memory request equals memory limit (Guaranteed QoS class). Prevents overcommit. |
burstable | Memory request is less than limit (Burstable QoS class). Allows burst above the request. |
Sizing Overrides
Operators can pin CPU and/or memory values at any scope instead of relying on the algorithm. Overrides are useful for known-heavy jobs, cost caps, or bootstrapping new workflows before enough historical data exists.
Scope Hierarchy
Overrides resolve with most-specific wins:
job > workflow > repo > org
Fields left null in an override are inherited from the next parent scope (or the algorithm). This means you can override only memory at the org level and let CPU continue to be computed from data.
Override API
| Method | Path | Description |
|---|
GET | /api/v1/sizing/overrides | List all overrides |
PUT | /api/v1/sizing/overrides/{org} | Upsert org-level override |
PUT | /api/v1/sizing/overrides/{org}/{repo} | Upsert repo-level override |
PUT | /api/v1/sizing/overrides/{org}/{repo}/{workflow} | Upsert workflow-level override |
PUT | /api/v1/sizing/overrides/{org}/{repo}/{workflow}/{job} | Upsert job-level override |
DELETE | Same paths as PUT | Remove override at that scope |
When an override is active, the sizing response includes override_scope in the meta block indicating which level matched (job, workflow, repo, org). When no override matched, the value is "global".
OOM-Aware Sizing
When OOM events are detected (via cgroup v2 memory.events or the 95%-of-limit heuristic), the sizer applies special handling:
- OOM-suspect samples are excluded from the clean sample count — they do not advance the confidence phase
- Exponential backoff on consecutive OOMs:
limit × 2^consecutiveOOMs - Node ceiling cap — backoff is bounded by the node ceiling (90% of node RAM or
--max-memory)
This ensures the sizer recovers gracefully from memory exhaustion without unbounded growth. For full details, see OOM Detection.
For the full sizing API response format, see the API Reference.
3.4 - OOM Detection & Confidence-Gated Sizing
How CI Sizer detects out-of-memory events and adapts sizing recommendations through confidence phases.
Overview
CI Sizer v0.7.0 introduces confidence-gated sizing — a system that adapts recommendation aggressiveness based on how much data is available for a given workflow/job. Combined with OOM detection, the sizer can automatically recover from memory exhaustion events by applying exponential backoff and notifying the source forge via commit status.
Confidence Phases
Every workflow/job combination progresses through three confidence phases as the sizer accumulates clean (non-OOM) samples:
| Phase | Condition | Behaviour |
|---|
| unknown | 0 clean samples | Returns a bootstrap default of 4Gi memory. API responds with HTTP 200 and meta.confidence_phase == "unknown". |
| learning | 1–2 clean samples | Applies 3× headroom above observed peak. Conservative to avoid OOMs while data is sparse. |
| confident | ≥3 clean samples | Uses the tight staircase buffer (20%/10%/5%). Full algorithm precision. |
Client Note
The bootstrap phase (0 samples) now returns HTTP 200 instead of 404. Clients should check meta.confidence_phase to distinguish bootstrap defaults from data-driven recommendations.OOM Detection
Cgroup v2 Detection
The collector sidecar reads the cgroup v2 memory.events file and monitors the oom_kill counter. When the counter increments during a run, the sample is marked as an OOM event.
Source: internal/cgroup/oom.go
Heuristic Detection
For environments where the oom_kill counter is not available (e.g., cgroup v1), the sizer applies a heuristic: if the observed peak memory reaches ≥95% of the configured limit, the sample is marked as OOM-suspect. OOM-suspect samples are excluded from the clean sample count used for confidence phase progression.
Exponential Backoff
When consecutive OOMs are detected for a workflow/job, the sizer applies exponential backoff to the memory limit:
new_limit = current_limit × 2^consecutiveOOMs
The backoff is capped at the node ceiling to prevent unbounded growth.
Node Ceiling
The maximum memory allocation is bounded by the node ceiling, which is determined by:
- Auto-detection — reads
/proc/meminfo and uses 90% of total node RAM - Manual override — configurable via
--max-memory flag
Similarly, --max-cpu caps the maximum CPU allocation.
Commit Status Notifications
When an OOM event is detected, the receiver posts a commit status notification to the source forge, alerting developers that their CI run was killed due to memory exhaustion.
Forgejo / GitHub
POST /api/v1/repos/{owner}/{repo}/statuses/{sha}
GitLab
POST /api/v4/projects/{id}/statuses/{sha}
Authentication is via the PRIVATE-TOKEN header for GitLab or Bearer token for Forgejo/GitHub.
Configuration
| Flag | Environment Variable | Description | Default |
|---|
--notify-enabled | RECEIVER_NOTIFY_ENABLED | Enable commit status notifications | true |
--notify-base-url | RECEIVER_NOTIFY_BASE_URL | Forge base URL (auto-detected from push metadata if unset) | — |
--notify-token | RECEIVER_NOTIFY_TOKEN | API token for forge commit status API | — |
In most deployments, only --notify-token is required. The base URL and node ceiling are auto-detected.
Source: internal/receiver/notify/notify.go
Web UI Indicators
The web dashboard surfaces OOM information through several visual elements:
- Confidence badges — displayed per workflow/job showing the current phase (unknown, learning, confident)
- OOM banners — warning banners on affected workflow/job pages
- Red markers on charts — individual OOM’d runs are highlighted with red markers on the timeline chart
Sizing Response
When OOM detection is active, the sizing API response includes additional fields in the meta block:
{
"meta": {
"confidence_phase": "learning",
"clean_samples": 3,
"consecutive_ooms": 1,
"node_ceiling_memory": "28Gi",
"node_ceiling_cpu": "14"
}
}
Source Files
| File | Purpose |
|---|
internal/cgroup/oom.go | Cgroup v2 OOM detection via memory.events |
internal/receiver/sizing/confidence.go | Confidence phase logic and phase transitions |
internal/receiver/notify/notify.go | Commit status notification dispatch |
3.5 - Energy Estimation
Methodology and sources for CI Sizer’s energy consumption and carbon footprint estimates.
Overview
CI Sizer estimates the energy consumption and carbon footprint of CI/CD runner executions using established industry models. CPU utilization data collected by the collector sidecar (from /proc/stat) is combined with hardware power characteristics and grid carbon intensity to produce per-run energy scores.
These are statistical estimates, not real power measurements. They are suitable for trend analysis, cross-run comparison, and sustainability reporting.
Power Estimation Models
Teads SPECpower Curve (TDP-based)
When the hardware’s Thermal Design Power (TDP) is known and no per-vCPU min/max watt bounds are set, power is estimated using a 4-point piecewise linear interpolation derived from SPECpower benchmark data.
| CPU Utilization | Power Coefficient (x TDP) |
|---|
| 0% | 0.12 |
| 10% | 0.32 |
| 50% | 0.75 |
| 100% | 1.02 |
Power(u) = TDP x interpolate(u, [0, 10, 50, 100], [0.12, 0.32, 0.75, 1.02])
Between anchor points, values are linearly interpolated. The 1.02 coefficient at 100% accounts for turbo-boost overshoot above nominal TDP.
Source: Benjamin Davy, Teads Engineering (2021), standardized by the Green Software Foundation Impact Framework.
References:
CCF Linear Model (vCPU-based)
When only the vCPU count is known (or when per-vCPU min/max watt bounds are available), the Cloud Carbon Footprint linear interpolation model is used.
Power = vCPUs x (MinWatts + u x (MaxWatts - MinWatts))
Default coefficients (AWS average from SPECpower_ssj2008 benchmarks):
| Parameter | Value | Meaning |
|---|
MinWatts | 0.74 W/vCPU | Idle power per vCPU |
MaxWatts | 3.50 W/vCPU | Max-load power per vCPU |
When a specific CPU is auto-detected, TDP-derived bounds replace the defaults:
MinWatts = TDP x 0.12 / vCPUs (idle fraction from Teads curve)
MaxWatts = TDP x 1.02 / vCPUs (max fraction from Teads curve)
Reference: Cloud Carbon Footprint Methodology
Model Selection
| Condition | Model Used |
|---|
| Profile has per-vCPU min/max watts (both > 0) | CCF Linear |
| Profile has TDP only (no min/max watts) | Teads Curve |
In practice, auto-detected CPUs derive min/max watts from TDP, so the CCF linear model is used for both generic and auto-detected profiles. The Teads curve is only used when a user provides a raw TDP-only hardware profile.
Energy Calculation
Energy_raw (kWh) = Power (W) x Duration (s) / 3600 / 1000
Energy_adjusted (kWh) = Energy_raw x PUE
Power Usage Effectiveness (PUE)
A PUE of 1.3 means the datacenter uses 30% more energy than the IT equipment alone. This is a conservative middle ground:
| Context | Typical PUE |
|---|
| Hyperscalers (Google, AWS, Azure) | 1.10–1.18 |
| New datacenter builds (Uptime 2024) | ~1.3 |
| Industry average | 1.56 |
Provider-specific PUEs (from Cloud Carbon Footprint):
| Provider | PUE |
|---|
| AWS | 1.135 |
| GCP | 1.1 |
| Azure | 1.125 |
References:
Carbon Intensity
Carbon emissions are calculated as:
Carbon (gCO2eq) = Energy (kWh) x CarbonIntensity (gCO2eq/kWh)
Carbon intensity is resolved through a 3-tier fallback chain. Each tier is tried in order; the first successful response wins. The methodology string always reflects which tier actually supplied the data.
Data Quality Comparison
The tiers differ fundamentally in what they measure — not just in precision:
| Energy Charts (Tier 1) | FfE Projection (Tier 2) | Static Table (Tier 3) |
|---|
| Data type | Real MW from actual power plants | Modeled scenario projection | Derived seasonal averages |
| Updates | Every 15 minutes | Static per projection year | Never (compiled into binary) |
| Accuracy | Actual grid state right now | Weather-year-2012 estimate | Seasonal/hourly average |
| Zones | 13 EU countries | DE only | 13 EU countries |
| Availability | Sometimes delayed or unavailable | Always available | Always available |
| Reflects today’s weather | ✅ Yes — real wind/solar/demand | ❌ No — same values every year for the same hour | ❌ No — averaged over months |
Tier 1: Energy Charts Real-Time (default)
| Property | Value |
|---|
| Source | Fraunhofer Institute for Solar Energy Systems (Fraunhofer ISE) |
| API | https://api.energy-charts.info/public_power?country={cc} |
| Data | Real-time actual generation — MW output from real power plants operating right now |
| Resolution | 15-minute intervals, updated continuously |
| Authentication | None required |
| Cache | In-memory, 15-minute TTL (matching data resolution) |
| Methodology string | energy-charts |
| Supported zones | DE, AT, FR, NL, PL, DK, CH, ES, IT, BE, SE, NO, FI |
Direct carbon intensity calculation: Carbon intensity is calculated directly from the generation mix using IPCC AR5 lifecycle emission factors per fuel type: grid_intensity = Σ(fuel_MW × emission_factor) / Σ(generation_MW). Each 15-minute interval’s generation data is fetched from the /public_power endpoint. For each production type with a known emission factor, the MW output is multiplied by the factor; the weighted sum is divided by total generation to yield gCO₂eq/kWh. Negative values (storage consumption) and non-generation keys (Load, Battery Consumption, etc.) are excluded.
IPCC AR5 lifecycle emission factors used by CI Sizer:
| Fuel Type (Energy Charts name) | gCO₂eq/kWh | Source |
|---|
| Fossil peat | 1100 | IPCC AR5 |
| Fossil brown coal / lignite | 1054 | IPCC AR5 |
| Fossil hard coal | 888 | IPCC AR5 |
| Fossil coal-derived gas | 850 | IPCC AR5 |
| Fossil oil | 733 | IPCC AR5 |
| Fossil gas | 410 | IPCC AR5 |
| Others | 400 | Conservative estimate |
| Waste | 330 | IPCC AR5 (mixed waste) |
| Biomass | 230 | IPCC AR5 |
| Solar | 45 | IPCC AR5 |
| Geothermal | 38 | IPCC AR5 |
| Other renewables | 30 | IPCC AR5 |
| Hydro Run-of-River | 24 | IPCC AR5 |
| Hydro water reservoir | 24 | IPCC AR5 |
| Hydro pumped storage | 24 | IPCC AR5 |
| Nuclear | 12 | IPCC AR5 |
| Wind offshore | 12 | IPCC AR5 |
| Wind onshore | 11 | IPCC AR5 |
For example, when the grid runs on 5000 MW lignite and 5000 MW gas: (5000×1054 + 5000×410) / 10000 = 732 gCO₂eq/kWh.
This approach calculates intensity directly from the actual fuel dispatch, providing more accurate values than the previous simplified formula.
Reference: Fraunhofer ISE — Energy Charts
Tier 2: FfE Projection Data (first fallback)
| Property | Value |
|---|
| Source | Forschungsstelle für Energiewirtschaft (FfE), Munich |
| Data | Modeled projection — 8760 hourly values from the Dynamis energy scenario model, based on weather reference year 2012 |
| Storage | Azure blob storage (no rate limits): ffeopendatastorage.blob.core.windows.net |
| License | CC-BY-4.0 |
| Year selection | Nearest available projection year (2020, 2025, 2030, 2035, 2040, 2045, 2050) |
| Cache | In-memory, 24-hour TTL (data is static per year) |
| Methodology string | ffe-projection |
These are modeled projections, NOT actual measurements. The simulation uses weather reference year 2012 to produce a plausible hourly carbon intensity profile. This means:
- The same hour-of-year always returns the same value, regardless of when you query
- It captures realistic seasonal and diurnal patterns (e.g., midday solar dips, winter peaks)
- It cannot reflect today’s actual wind speed, cloud cover, or demand conditions
Note: FfE projection data is only available for Germany (zone DE). For other zones, Tier 2 is skipped and the chain falls through directly to Tier 3.
The data is produced under the InDEED research project (Integrating Decentralized Energy Data).
Reference: FfE OpenData (InDEED project)
Tier 3: Static Lookup Table (last resort)
A 192-value lookup table for all 13 supported zones, indexed by season (4), day type (weekday/weekend), and hour (24). Derived from Energy Charts /public_power data (2025–2026, IPCC AR5 emission factors).
| Pattern | Range (gCO2/kWh) | Cause |
|---|
| Summer midday (10:00–14:00) | 220–265 | High solar generation (DE example) |
| Summer night (00:00–05:00) | 470–525 | Fossil baseload (DE example) |
| Winter (all day) | 350–435 | Flatter, wind-dependent (DE example) |
| Weekend vs. weekday | 10–20% lower | Reduced industrial demand |
Methodology string: static
Methodological basis:
- Kono, J., Ostermeyer, Y. & Wallbaum, H. (2017). “The trends of hourly carbon emission factors in Germany and investigation on relevant consumption patterns for its application.” International Journal of Life Cycle Assessment, 22, 1493–1501. DOI: 10.1007/s11367-017-1277-z
- Holzapfel, P., Bach, V. & Finkbeiner, M. (2023). “Increasing temporal resolution in greenhouse gas accounting of electricity consumption divided into Scopes 2 and 3.” International Journal of Life Cycle Assessment, 28, 1622–1639. DOI: 10.1007/s11367-023-02240-3
Last-Resort Fallback
| Parameter | Value |
|---|
| Intensity | 380 gCO2eq/kWh |
Updated from 400 g/kWh in v0.2.x to reflect declining German grid intensity. Per Umweltbundesamt (UBA), the annual average was 386 g/kWh (2023) and 363 g/kWh (2024). The carbon_source field is set to "fallback" to flag this condition.
Reference: Umweltbundesamt — Strom- und Wärmeversorgung in Zahlen
Provider Selection
The --carbon-provider flag (or RUNNER_CARBON_PROVIDER env var) controls which providers are used:
| Value | Behavior | Use Case |
|---|
energy-charts (default) | Full 3-tier chain: Energy Charts → FfE projection → static table | Best accuracy; requires internet access |
ffe | Legacy alias — creates the same full 3-tier chain as energy-charts | Backward compatibility |
static | Static lookup table only (no external dependencies) | Air-gapped environments, deterministic testing |
Multi-Country Carbon Zones
CI Sizer supports 13 European electricity grid zones for carbon intensity estimation. The zone is configured via the --carbon-zone flag or RUNNER_CARBON_ZONE environment variable (default: DE).
Supported Zones
| Zone | Country | Typical CI (gCO₂eq/kWh) | Notes |
|---|
AT | Austria | ~67 | Hydro-dominated |
BE | Belgium | ~179 | Gas + nuclear mix |
CH | Switzerland | ~42 | Hydro + nuclear |
DE | Germany | ~258 | Mixed (coal/gas/wind/solar) |
DK | Denmark | ~88 | Wind-heavy |
ES | Spain | ~94 | Solar + wind + gas |
FI | Finland | ~59 | Nuclear + hydro + biomass |
FR | France | ~24 | Nuclear-dominated |
IT | Italy | ~206 | Gas-heavy |
NL | Netherlands | ~369 | Gas-dominated |
NO | Norway | ~28 | Hydro-dominated |
PL | Poland | ~505 | Coal-dominated |
SE | Sweden | ~33 | Hydro + nuclear |
Configuration
# French grid (nuclear-dominated, very low CI)
./collector --carbon-zone FR
# Or via environment variable
RUNNER_CARBON_ZONE=PL ./collector
Provider Chain by Zone
The fallback chain differs depending on the selected zone:
- DE (Germany): Energy Charts → FfE blob projection → static (seasonal/weekday table with 192 values)
- All other zones: Energy Charts → static (seasonal/weekday table with 192 values)
FfE projection data (Tier 2) is only available for Germany. For all other zones, the provider chain skips FfE and falls back directly to the static table. All 13 supported zones have full 192-value static tables (4 seasons × 2 day types × 24 hours) derived from Energy Charts data. If all providers fail, the hardcoded 380 gCO₂/kWh fallback is used regardless of zone.
CPU TDP Database
A built-in database of 38 CPU models maps processor names to TDP (Thermal Design Power) values:
| Family | Generations | TDP Range |
|---|
| Intel Xeon Platinum | Skylake, Cascade Lake, Ice Lake, Sapphire Rapids | 195–350 W |
| Intel Xeon Gold | Various | 165–205 W |
| Intel Xeon Silver | Various | 100–135 W |
| Intel Xeon E5 | Ivy Bridge, Haswell, Broadwell | 115–145 W |
| AMD EPYC Rome | 7000-series | 225–280 W |
| AMD EPYC Milan | 7000-series | 225–280 W |
| AMD EPYC Genoa | 9000-series | 360 W |
| AWS Graviton | Graviton2, Graviton3, Graviton4 | 130–210 W |
| Ampere | Altra, AmpereOne | 160–210 W |
Sources:
Graviton TDP values (Graviton2 ~130 W, Graviton3 ~180 W, Graviton4 ~210 W) are engineering estimates based on ARM Neoverse power characteristics, not manufacturer specifications.
Confidence Levels
Each energy score includes a confidence field indicating the quality of the estimate:
| Level | Hardware Source | Typical Accuracy |
|---|
user-provided | User explicitly specified hardware | Depends on user |
auto-detected | CPU model matched in TDP database | ±15–20% |
generic-estimate | Fell back to average cloud defaults | ±50% |
The confidence level reflects the hardware profile quality. Carbon data source quality is captured separately in the carbon_source field (energy-charts, ffe-projection, static, or fallback).
Limitations
| Limitation | Impact |
|---|
| Statistical approximation | Power estimates are modeled, not measured from hardware power meters |
| CPU-only power model | Memory, storage, network, and GPU power are not modeled separately |
| Carbon intensity variability | Hourly/15-min data is preferred over annual averages; actual intensity varies by time of day and season |
| Energy Charts emission factors | IPCC AR5 lifecycle emission factors per fuel type are median values; actual plant-level emissions vary, giving ±10–15% uncertainty |
| FfE projection data | Based on the Dynamis energy scenario model; projection years (2025, 2030, etc.) may not match actual grid conditions |
| Graviton/ARM TDP estimates | Not manufacturer specifications; based on ARM Neoverse power characteristics |
| Uniform PUE | Single global default; actual PUE varies by datacenter location, load, and ambient temperature |
| Limited zone support | Carbon intensity available for 13 European zones via Energy Charts (DE, AT, FR, NL, PL, DK, CH, ES, IT, BE, SE, NO, FI). FfE projection data is DE-only. Static fallback covers all 13 zones with full seasonal/weekday/hourly resolution. Unsupported zones use 380 gCO₂/kWh fallback |
| Average utilization | Mean CPU utilization over the run smooths out short spikes |
Verifying the Data
You can query the upstream carbon intensity sources directly to verify what CI Sizer is seeing.
Reading the Methodology String
Each energy score in CI Sizer includes a methodology string like:
ccf-linear+energy-charts+DE+pue-1.30
| Part | Meaning |
|---|
ccf-linear | Power model — Cloud Carbon Footprint linear interpolation (vCPUs × watts) |
energy-charts | Carbon intensity source that successfully returned data |
DE | Electricity grid zone |
pue-1.30 | Power Usage Effectiveness multiplier (1.3× datacenter overhead) |
If the carbon source shows ffe-projection or static instead of energy-charts, the system fell back because Energy Charts was unavailable.
Querying Energy Charts (Tier 1)
The Energy Charts API requires lowercase country codes and date-only format (no timestamps):
# German grid generation mix for today (replace dates with today/tomorrow)
curl -s "https://api.energy-charts.info/public_power?country=de&start=2026-05-20&end=2026-05-21" \
| jq '{
timestamps: (.unix_seconds | length),
first: (.unix_seconds[0] | todate),
last: (.unix_seconds[-1] | todate),
fuels: [.production_types[] | .name]
}'
# See actual MW per fuel type at a specific timestamp
curl -s "https://api.energy-charts.info/public_power?country=de&start=2026-05-20&end=2026-05-21" \
| jq '{
time: (.unix_seconds[40] | todate),
generation_MW: [.production_types[] | select(.data[40] != null and .data[40] > 0) | {(.name): (.data[40] | round)}] | add
}'
# French grid (nuclear-dominated, very low carbon)
curl -s "https://api.energy-charts.info/public_power?country=fr&start=2026-05-20&end=2026-05-21" \
| jq '[.production_types[] | .name]'
The response contains unix_seconds[] (15-minute intervals) and production_types[{name, data[]}] with MW output per fuel type. CI Sizer multiplies each fuel’s MW by its IPCC AR5 emission factor and divides by total generation to compute gCO₂eq/kWh.
Important: Replace the dates in the examples with today’s date. The API returns data up to the most recent 15-minute interval.
Computing Grid Carbon Intensity
To replicate the exact calculation CI Sizer performs — weighted average of generation MW × emission factor:
# Compute current German grid carbon intensity (same formula as ci-sizer)
curl -s "https://api.energy-charts.info/public_power?country=de&start=$(date -u +%Y-%m-%d)&end=$(date -u -v+1d +%Y-%m-%d)" | jq '
(.unix_seconds | length - 1) as $idx |
(.unix_seconds[$idx] | todate) as $time |
{"Fossil brown coal / lignite":1054,"Fossil hard coal":888,"Fossil gas":410,
"Fossil oil":733,"Fossil coal-derived gas":850,"Fossil peat":1100,
"Nuclear":12,"Biomass":230,"Geothermal":38,"Wind offshore":12,
"Wind onshore":11,"Solar":45,"Hydro Run-of-River":24,
"Hydro water reservoir":24,"Hydro pumped storage":24,
"Waste":330,"Others":400,"Other renewables":30} as $f |
[.production_types[] | select(.data[$idx]!=null and .data[$idx]>0) |
{name,mw:.data[$idx]} | select($f[.name]!=null) |
{name,mw,w:(.mw*$f[.name])}] as $g |
{timestamp: $time,
grid_carbon_intensity_gCO2_per_kWh: ([$g[]|.w]|add)/([$g[]|.mw]|add)|round,
total_generation_MW: ([$g[]|.mw]|add)|round,
top_contributors: [$g | sort_by(-.w)[0:5][] | {fuel:.name, MW:(.mw|round), share_pct:((.w/([$g[]|.w]|add)*100)*10|round/10)}]}'
This takes the most recent 15-minute interval, multiplies each fuel type’s MW output by its IPCC emission factor, sums the weighted values, and divides by total generation to get gCO₂eq/kWh. The top_contributors field shows which fuels are driving most of the carbon impact.
Note: On Linux, replace date -v+1d with date -d "+1 day". Or simply hardcode tomorrow’s date.
Querying FfE Projection (Tier 2)
The FfE blob contains 8760 hourly projection values for an entire year (DE only):
# Get 2025 projection metadata
curl -s "https://ffeopendatastorage.blob.core.windows.net/opendata/id_opendata_2/id_opendata_2_year_2025.json" \
| jq '[.[] | select(.internal_id == [2,1,1])][0] | {
year: .year,
weather_reference_year: .year_weather,
total_hours: (.values | length),
annual_average_gCO2_per_kWh: (.value * 1000 | round),
unit: "values are in kg/kWh, multiply by 1000 for g/kWh"
}'
# Get projection for a specific hour (e.g., May 20 at 09:00 UTC = hour index 3345)
curl -s "https://ffeopendatastorage.blob.core.windows.net/opendata/id_opendata_2/id_opendata_2_year_2025.json" \
| jq '[.[] | select(.internal_id == [2,1,1])][0] | {
hour_index: 3345,
carbon_intensity_gCO2_per_kWh: (.values[3345] * 1000 | round),
note: "This is a modeled projection, not real-time data"
}'
Note: Hour index = (day_of_year - 1) × 24 + hour_utc. These values are static projections based on weather year 2012 — they will return the same result regardless of when you query them.
Tier 3 (Static Table)
The static fallback table is compiled into the binary — there is no external API to query. It provides 192 values per zone (4 seasons × 2 day types × 24 hours) derived from Energy Charts historical data.
3.6 - API Reference
REST API reference for the CI Sizer collector and receiver.
Overview
All endpoints are under /api/v1 unless noted otherwise. The OpenAPI specification is auto-generated and served live at /swagger on the receiver. The spec file is also available at docs/openapi.json in the repository.
Authentication
CI Sizer uses a two-tier token system:
- Read token (
--read-token): Pre-shared admin credential for read/query endpoints. Used as Authorization: Bearer <read-token>. - Push tokens (derived from
--hmac-key): Scoped, time-limited HMAC-SHA256 tokens for collectors. Generated via POST /api/v1/token.
Authentication behaviour depends on the configured auth mode. See Configuration — Authentication Modes for details.
Authentication by Endpoint (OIDC Mode)
In oidc mode, endpoints use two tiers. The relaxed tier also accepts a Bearer read token, enabling programmatic access (e.g., from the GARM provider).
| Endpoint | Auth Tier | OIDC Session | Bearer Read Token |
|---|
GET /health | None | — | — |
POST /api/v1/token | Read token | — | Yes |
POST /api/v1/metrics | Push token | — | — |
GET /api/v1/sizing/* | Relaxed | Yes | Yes |
GET /api/v1/runners/overview | Relaxed | Yes | Yes |
GET /api/v1/runners/{runner} | Relaxed | Yes | Yes |
| All other protected endpoints | Strict | Yes | No |
In gateway mode, replace “OIDC Session” with “Gateway JWT (X-Access-Token)”. In none mode, all protected endpoints accept the Bearer read token.
Health and Info
No authentication required.
| Method | Path | Description |
|---|
GET | /health | Health check |
GET | /api/v1/info | Service info (version, auth mode, CI provider, forgejo_base_url, logout_url) |
Token and Metrics Ingest
| Method | Path | Auth | Description |
|---|
POST | /api/v1/token | Read token | Generate a scoped push token |
POST | /api/v1/metrics | Push token | Receive and store a metric summary |
Push Token Generation
curl -s -X POST http://localhost:8080/api/v1/token \
-H "Authorization: Bearer <read-token>" \
-H "Content-Type: application/json" \
-d '{"organization":"my-org","repository":"my-repo","workflow":"ci.yml","job":"build"}'
The returned token is scoped to the specified org/repo/workflow/job combination and expires after the configured --token-ttl (default: 2 hours).
Metrics Query
| Method | Path | Description |
|---|
GET | /api/v1/metrics/repo/{org}/{repo}/{workflow}/{job} | Query stored metrics for a workflow/job |
GET | /api/v1/metrics/runner/{runner} | Query stored metrics for a specific runner |
GET | /api/v1/debug/metrics | Dump all metric rows from the database |
Metrics Response Example
[
{
"id": 1,
"organization": "my-org",
"repository": "my-org/my-repo",
"workflow": "ci.yml",
"job": "build",
"run_id": "run-123",
"received_at": "2026-02-06T14:30:23.056Z",
"payload": {
"start_time": "2026-02-06T14:30:02.185Z",
"end_time": "2026-02-06T14:30:22.190Z",
"duration_seconds": 20.0,
"sample_count": 11,
"containers": [
{
"name": "runner",
"cpu_cores": { "peak": 2.007, "avg": 1.5, "p50": 1.817, "p95": 2.004 },
"memory_bytes": { "peak": 18567168, "avg": 18567168 }
}
]
}
}
]
CPU metric distinction:
cpu_total_percent — system-wide, 0–100%cpu_cores (containers) — cores used (e.g., 2.0 = two full cores)peak_cpu_percent (processes) — per-process, where 100% = 1 core
All memory values are in bytes.
Sizing
| Method | Path | Description |
|---|
GET | /api/v1/sizing/repo/{org}/{repo}/{workflow}/{job} | Compute container sizes from historical data |
Query Parameters
| Parameter | Default | Description |
|---|
runs | 5 | Number of recent runs to analyse (1–100) |
buffer | 20 | CPU headroom percentage (memory uses a staircase buffer) |
cpu_percentile | p95 | CPU stat to use: peak, p99, p95, p75, p50, avg |
Sizing Response Example
{
"containers": [
{
"name": "runner",
"cpu": { "request": "960m", "limit": "1", "enforced": false },
"memory": { "request": "1024Mi", "limit": "1024Mi", "enforced": true }
}
],
"total": {
"cpu": { "request": "970m", "limit": "1500m" },
"memory": { "request": "647Mi", "limit": "1024Mi" }
},
"meta": {
"runs_analyzed": 10,
"buffer_percent": 20,
"cpu_percentile": "p95",
"cpu_sizing_mode": "observe",
"memory_qos": "guaranteed"
}
}
For details on the sizing algorithm, buffers, and enforcement modes, see Sizing Algorithm.
Energy and Carbon
| Method | Path | Description |
|---|
GET | /api/v1/energy/repo/{org}/{repo}/{workflow}/{job} | Energy/carbon estimates for a workflow/job |
Supports ?from= and ?to= time range filters (ISO 8601).
Aggregation and Dashboard
All aggregation endpoints support ?from=, ?to= (ISO 8601) and ?limit= / ?offset= pagination.
| Method | Path | Description |
|---|
GET | /api/v1/metrics/overview | Global KPI summary with per-org breakdown |
GET | /api/v1/metrics/org/{org} | Org detail with per-repo summaries |
GET | /api/v1/metrics/org/{org}/repo/{repo} | Repo detail with per-workflow summaries |
GET | /api/v1/sizing/org/{org} | Org-wide sizing overview |
GET | /api/v1/sizing/org/{org}/repo/{repo} | Repo-wide sizing overview |
GET | /api/v1/compare/repos | Cross-repo KPI comparison (?org=) |
GET | /api/v1/compare/workflows | Cross-workflow KPI comparison (?org=&repo=) |
GET | /api/v1/runners | List known runners |
GET | /api/v1/runners/overview | Runner fleet overview |
GET | /api/v1/runners/{runner} | Runner detail with per-org breakdown |
GET | /api/v1/success-failure-stats/repo/{org}/{repo}/{workflow}/{job} | Pass/fail statistics |
Sizing Overrides
| Method | Path | Description |
|---|
GET | /api/v1/sizing/overrides | List all overrides |
PUT | /api/v1/sizing/overrides/{org} | Upsert org-level override |
PUT | /api/v1/sizing/overrides/{org}/{repo} | Upsert repo-level override |
PUT | /api/v1/sizing/overrides/{org}/{repo}/{workflow} | Upsert workflow-level override |
PUT | /api/v1/sizing/overrides/{org}/{repo}/{workflow}/{job} | Upsert job-level override |
DELETE | Same paths as PUT | Remove override at that scope |
Override hierarchy: job > workflow > repo > org (most-specific wins). Fields left null are inherited from the next parent scope. See Sizing Algorithm — Sizing Overrides for details.
OIDC UI Routes
Available when auth mode is oidc.
| Method | Path | Description |
|---|
GET | /ui/login | Initiate OIDC login |
GET | /ui/callback | OIDC callback |
GET | /ui/logout | Logout |
GET | /ui/me | Current user info |
OpenAPI Specification
The OpenAPI spec is auto-generated from the receiver’s route definitions and served live at /swagger. The spec file is also committed to the repository at docs/openapi.json.
Note: The OpenAPI spec is generated code — do not edit it manually. Run make openapi in the ci-sizer repository to regenerate it after API changes.
3.7 - GitLab CI Integration
Integrating CI Sizer with GitLab CI via the MutatingAdmissionWebhook.
Overview
CI Sizer supports GitLab CI through the gitlab-webhook-edge-connect component — a Kubernetes MutatingAdmissionWebhook that intercepts GitLab Runner executor pods and injects the CI Sizer collector sidecar.
Unlike Forgejo/GitHub Actions (which use GARM for runner lifecycle management), GitLab Runner uses its own Kubernetes executor. The webhook intercepts pods at admission time and mutates them to include the collector.
Repository: edp.buildth.ing/DevFW-CICD/gitlab-webhook-edge-connect
Architecture
┌──────────────────────────────────────────────────────────────────┐
│ Kubernetes API Server │
│ │
│ MutatingAdmissionWebhook │
│ ┌────────────────────────────────────┐ │
│ │ gitlab-webhook-edge-connect │ │
│ │ │ │
│ │ Intercepts pods with label: │ │
│ │ job.runner.gitlab.com/pod (Exists)│ │
│ │ │ │
│ │ Injects: collector sidecar │ │
│ │ Sets: shareProcessNamespace=true │ │
│ └────────────────────────────────────┘ │
└──────────────────────────────────────────────────────────────────┘
Pod Targeting
The webhook targets GitLab Runner pods using a label selector (not annotation):
objectSelector:
matchExpressions:
- key: job.runner.gitlab.com/pod
operator: Exists
This label is automatically applied by the GitLab Runner Kubernetes executor to all job pods.
Design Decision
Label-based targeting was chosen over annotation-based targeting because MutatingAdmissionWebhook objectSelector only supports label selectors. This provides efficient server-side filtering without requiring the webhook to inspect every pod creation.Backends
The webhook supports two mutation backends:
| Backend | Description |
|---|
| KubernetesBackend | Inline mutation — directly patches the pod spec to add the collector sidecar |
| EdgeConnectBackend | SDK-based provisioning — provisions resources via the EdgeConnect SDK |
Collector Injection
The collector is injected using the shared library ci-sizer/pkg/inject, which is common across all CI providers. The injection adds:
- A collector sidecar container
shareProcessNamespace: true on the pod spec- Appropriate environment variables for CI context
Cgroup Exclusion Strategy
GitLab Runner pods present a unique challenge: the build container’s process name varies by image (it could be sh, bash, pwsh, or any custom entrypoint). This makes positive identification by process name impossible.
CI Sizer solves this with an exclusion strategy:
- Map all known containers by process name (e.g.,
gitlab-runner-helper, collector) - Any remaining cgroup paths that don’t match a known container are assigned to the build container
This is configured via:
CGROUP_STRATEGY=exclusion
Note
The GitLab Runner helper process name (gitlab-runner-helper) is truncated to 15 characters in /proc/PID/status due to the Linux kernel’s Name field limit. The exclusion strategy accounts for this truncation.Run Index
For GitLab (non-GARM) providers, the run_index is assigned by the receiver using a MaxRunIndex+1 counter per org/repo/workflow combination. This provides sequential run numbering without requiring GARM lifecycle events.
Run URL
The run URL is propagated via the pod annotation job.runner.gitlab.com/url, which the collector reads at startup.
Runner Name
For GitLab, the runner_name is set to the pod name (pod.Name), since GitLab Runner pods are ephemeral and uniquely named per job.
Deployment
The webhook is deployed to the ci-sizer namespace with TLS provided by cert-manager using a self-signed issuer:
apiVersion: cert-manager.io/v1
kind: Certificate
metadata:
name: gitlab-webhook-tls
namespace: ci-sizer
spec:
secretName: gitlab-webhook-tls
issuerRef:
name: ci-sizer-selfsigned
kind: Issuer
dnsNames:
- gitlab-webhook-edge-connect.ci-sizer.svc
- gitlab-webhook-edge-connect.ci-sizer.svc.cluster.local
GitLab-Specific Configuration
| Variable | Description |
|---|
CI_SIZER_RUNNER_NAME | Override runner name (defaults to pod name) |
CGROUP_STRATEGY | Set to exclusion for GitLab pods |
CI_PROVIDER | Set to gitlab |
For commit status notifications to GitLab, see OOM Detection — Commit Status Notifications.
3.8 - KPI Benchmark
Full-benchmark results for CI Sizer against the IPCEI WP e.2 sustainability target: −62.1% memory-time vs the no-sizer baseline, ≥20% target cleared.
Overview
The KPI Benchmark measures CI Sizer against the IPCEI work-package e.2 sustainability target — a ≥20% improvement against the no-sizer baseline (“DevOps effectiveness effect”). The current canonical result, measured on ci-sizer v0.9.7 on the benchmark.t09.de shared Kubernetes cluster, is −62.1% memory-time vs the observe baseline across 12 productive workloads with 0 OOM kills. The ≥20% target is cleared by a factor of three.
Repository: edp.buildth.ing/DevFW/kpi-benchmark
Canonical report: results/full-2026-06-15-enforce/REPORT.md
Stakeholder report: Confluence — KPI e1 & e2 D62/D64
Test Parameters
| Parameter | Value |
|---|
| ci-sizer version | v0.9.7 |
| Conditions | 3 (bare, observe, enforce) |
| Workloads | 14 (12 productive + 2 architecturally excluded) |
| Iterations | 20 per workload per condition |
| Phase 5 enforce runs | 280 (observe/bare reused from Phase 4) |
| Phase 4 full-baseline run | 840 (14 × 3 × 20) — report |
| Infrastructure | benchmark.t09.de, OTC-hosted Kubernetes (CCE), kernel 5.10, cgroup v1 |
| Node spec | 64 GiB RAM |
| Data | results/full-2026-06-15-enforce/runs.jsonl |
Conditions
| Condition | Description |
|---|
bare | No ci-sizer — generous defaults set by GARM |
observe (baseline) | ci-sizer measures usage but does not enforce limits |
enforce | ci-sizer computes and applies CPU/memory limits per workflow |
The headline KPI compares enforce to observe: both run with the sizer present, isolating the effect of enforcement from the cost of presence. The bare condition is reported alongside for completeness.
Results
Reliability
| Condition | Productive-workload success | OOMs |
|---|
bare | 12 / 12 | 0 |
observe | 12 / 12 | 0 |
enforce | 12 / 12 (239 / 239 runs) | 0 |
The oom-test positive control reliably OOMs as designed (it allocates beyond any reasonable limit) and is excluded from the headline. memory-stress is excluded for architectural reasons described below.
Efficiency Gains
For the 12 productive workloads, enforce vs observe:
| Metric | Improvement |
|---|
| Memory-time (Mi·s) — the sustainability KPI | −62.1% (2,166,271 → 821,252 Mi·s) |
| CPU-time (millicore-seconds) — reported separately | +11.4% (548,535 → 611,031 m·s) |
Memory-time (reserved memory × wall time) is the right unit for the sustainability claim because reserved memory occupies a Kubernetes node 24/7 once allocated, regardless of whether the workflow is actively executing. Reclaiming over-provisioned memory is what frees capacity for other workloads and lets the cluster run on fewer nodes.
CPU-time is reported as a separate dimension. The modest CPU-time increase reflects intrinsic memory-pressure work on build workloads (more paging, more recomputation when tight memory limits defeat caching) rather than CPU throttling — Phase 5 ran without CPU limits precisely to isolate this effect.
What Works Well
- Build workloads dominate the savings. Memory-time reductions of −71% to −89% across
cmake-build, go-build, maven-build, multi-build, node-build, rust-build. Pattern: under observe these workloads opportunistically allocate several GiB (object-file caching, parallel compile workers, dependency graphs); under enforce at 256–512 Mi they adapt by paging/spilling and continue to complete successfully. ci-sizer correctly identifies that required memory is far less than opportunistic memory. - Zero silent OOMs. Every OOM event was correctly classified by condition; the instrumentation bug classes that contaminated the May 2026 dataset are all closed in the version benchmarked here.
- The ratchet holds learned floors across the run. Phase 5 confirms the confidence-gated sizing behaviour ships correctly.
Root Cause Analysis
A small number of workloads use slightly more memory under enforce than under observe. The headline reduction (−62.1%) is taken across all 12 productive workloads including these, so it already accounts for them. Two mechanisms drive the cases where enforce over-provisions:
1. minMemoryLimit floor (64 Mi)
The sizer refuses to recommend below 64 Mi even for workloads that use much less. This affects tiny-footprint workloads like steady-victim (~6 Mi true peak, ~10× over-provisioned) and mixed-workload (~30 Mi true peak, ~2× over-provisioned). The floor is a deliberate reliability guard against workloads with sub-second memory bursts that polling-based collection cannot see in time.
2. Headroom buffer (~20%)
Even with the floor removed, the sizer adds a margin above observed peak so the limit doesn’t sit exactly on the workload’s true usage. This is a genuine reliability cost and is the right behaviour: it prevents tail bursts from causing OOMs.
Both mechanisms are conservative choices that prevent OOMs in exchange for some over-provisioning.
Path Forward
| Issue | Planned approach |
|---|
Architecturally excluded workloads (memory-stress, oom-test) | Pod-cgroup-level sizing — would bring act-spawned step containers back into scope. See Sizing Algorithm and the report’s scope of further improvements. |
| Tiny-footprint over-provisioning | Lower or per-class-tunable floor for workloads classified as low-variance. |
| Headroom-buffer tuning | Per-workload variance classification to identify candidates for tighter buffers. |
| Bursty workloads invisible to polling | eBPF-based memory tracking or cgroup memory.events threshold notifications (replace 5–15 s polling on the residual edge cases). |
Architecturally Excluded Workloads
oom-test (positive control) and memory-stress are outside the per-container sizing model. Their memory pressure lives in act-spawned step containers that are sibling cgroups under the runner pod, not under the runner or buildkitd containers ci-sizer reads. See the report’s architectural exclusion section for the full reasoning.
Limitations & Transparency
| Limitation | Impact |
|---|
Single cluster (benchmark.t09.de) | All measurements on one OTC environment, kernel 5.10, cgroup v1. Cgroup v2 / newer kernel behaviour is not separately characterised in this run, though the collector supports both. |
| Workload mix is representative, not exhaustive | The 14-workload set was designed to span build/batch/memory-pressure shapes seen in EDP CI; production workloads outside this envelope may behave differently. |
| Per-container model | Two workloads architecturally excluded from the headline (see above). Re-including them is the largest single open item. |
| CPU-time cost is intrinsic, not configurable | The +11.4% CPU-time delta reflects genuine extra computational work under memory pressure and cannot be removed by configuration. Reported transparently rather than netted against the memory-time savings. |
History
Earlier iterations of this page reported figures from a single-host OrbStack (macOS arm64) pilot using ci-sizer v0.8.x. Those numbers reflected an early prototype of the collector under artificially high memory pressure (30 runners sharing 32 GiB) where instrumentation gaps and a not-yet-tuned recommendation algorithm produced apparent reliability regressions. Those issues — sampling-resolution gap, OOM feedback oscillation, insufficient buffer headroom — were diagnosed in Phases 2–3 and resolved across Phases 4–5. The full chronology is in EXPERIMENT-CHRONICLE.md, and the v0.9.5 → v0.9.7 trajectory specifically is in the UPDATE companion.
4 - Operations
Operational guides for deploying, monitoring, and maintaining the Edge Developer Platform components.
Operations Overview
This section outlines some of the operational aspects of the Edge Developer
Platform (EDP). The approach emphasizes a “developer operations” mode, primarily
focusing on monitoring and issue resolution rather than traditional operations.
Deployments
EDP Clusters
For details on deploying instances of EDP on OTC, see
this section.
Further Infrastructural References
Edge Connect
Discontinued — under reconstruction
The
edge and
orca Gardener clusters described in this subsection have been discontinued. The hub, console and Gardener URLs below are no longer reachable, and cluster-level
kubectl access via Gardener Account Settings is not available. The content is retained as historical reference pending the next iteration of the underlying infrastructure. See the
EdgeConnect overview for current status of the surrounding tooling.
The edge and orca clouds within Edge Connect serve as deployment targets for
EDP applications. These environments are Gardener
Kubernetes clusters.
For general use, interaction with Edge Connect is intended via its web UI:
https://hub.apps.edge.platform.mg3.mdb.osc.live
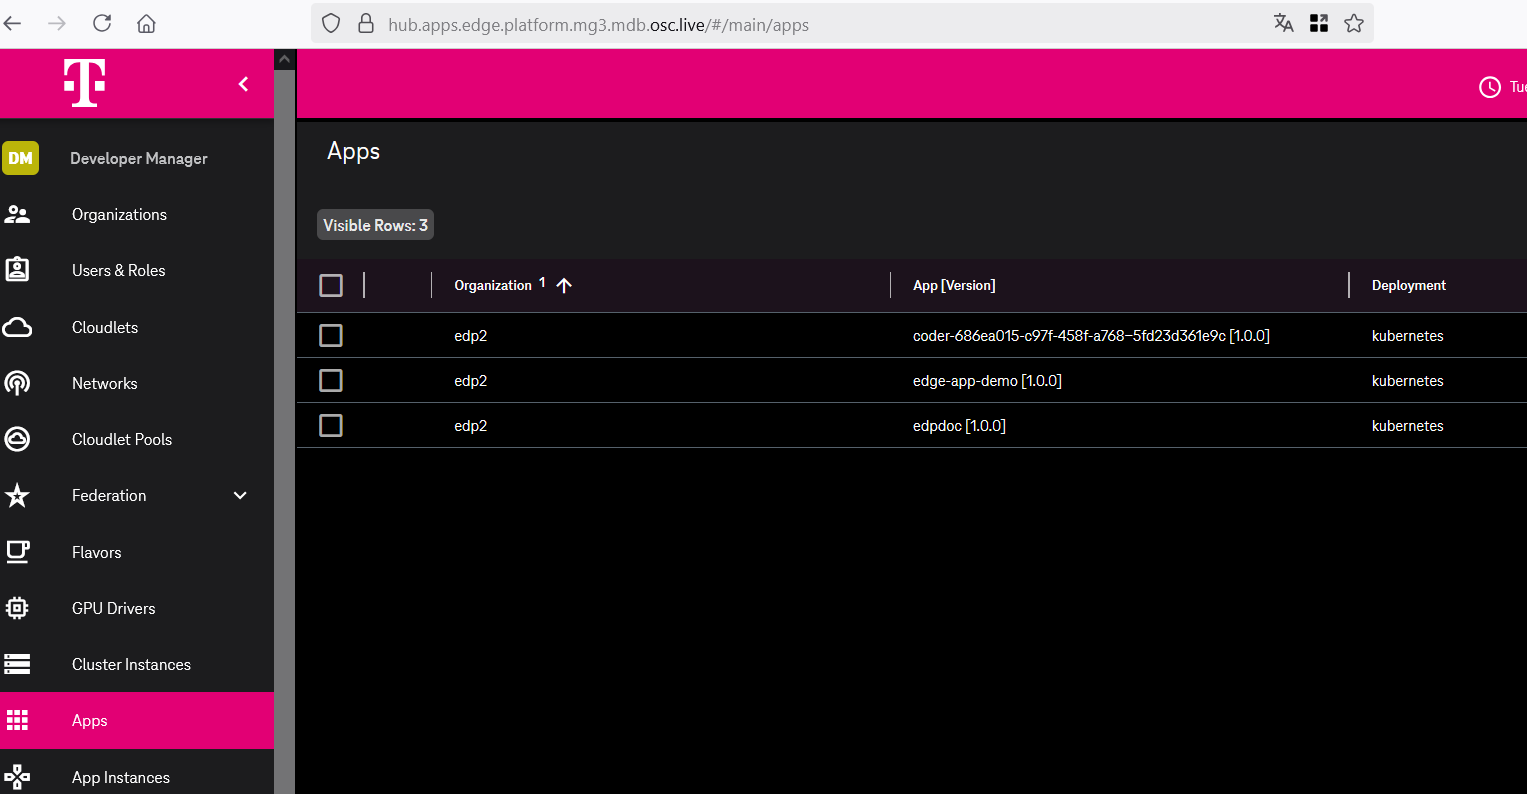
Further Infrastructural References
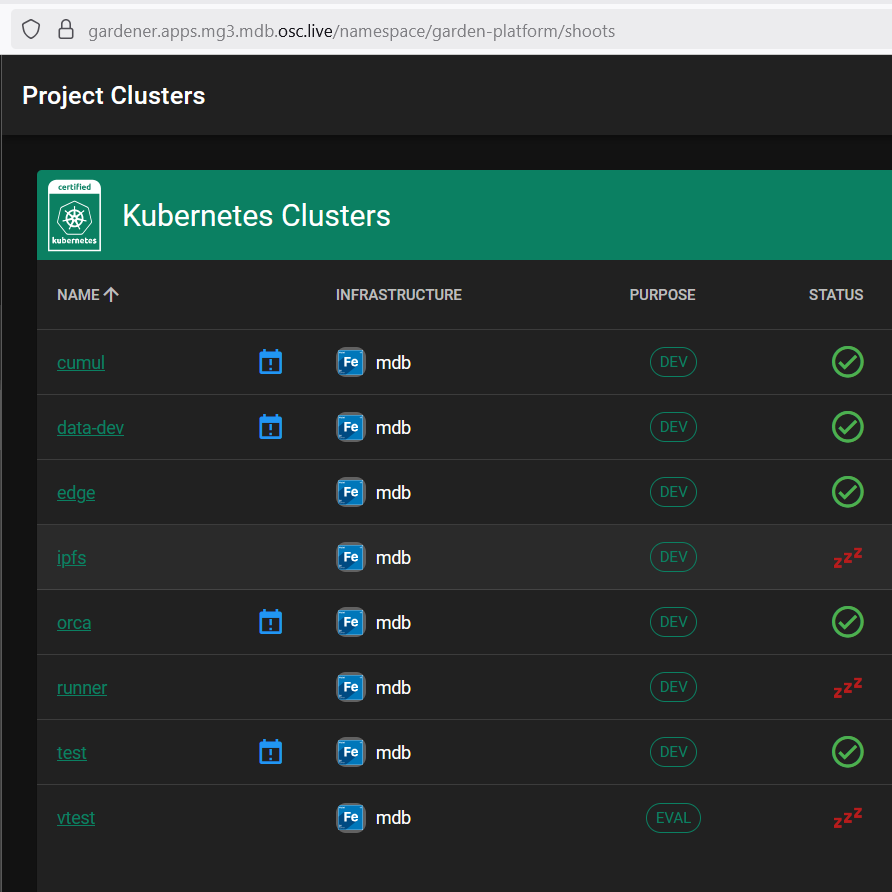
Cluster-level access is available for addressing operational issues. Details on
obtaining access are provided in the following resources:
Monitoring & Observability
The observability.buildth.ing cluster within the Prod OTC tenant is designated
for monitoring platform stacks, with visualization primarily through
Grafana. Currently, a formal
operational monitoring lifecycle with defined metrics and alerts is not fully
established, reflecting the current developer-centric operational mode.
Login credentials can be found in the grafana-admin-credentials secret within the cluster.
NOTE: The deployed stacks are depending on the is_observability flag setting (to include extra components for observability) in the deploy workflow within the infra-deploy repository.
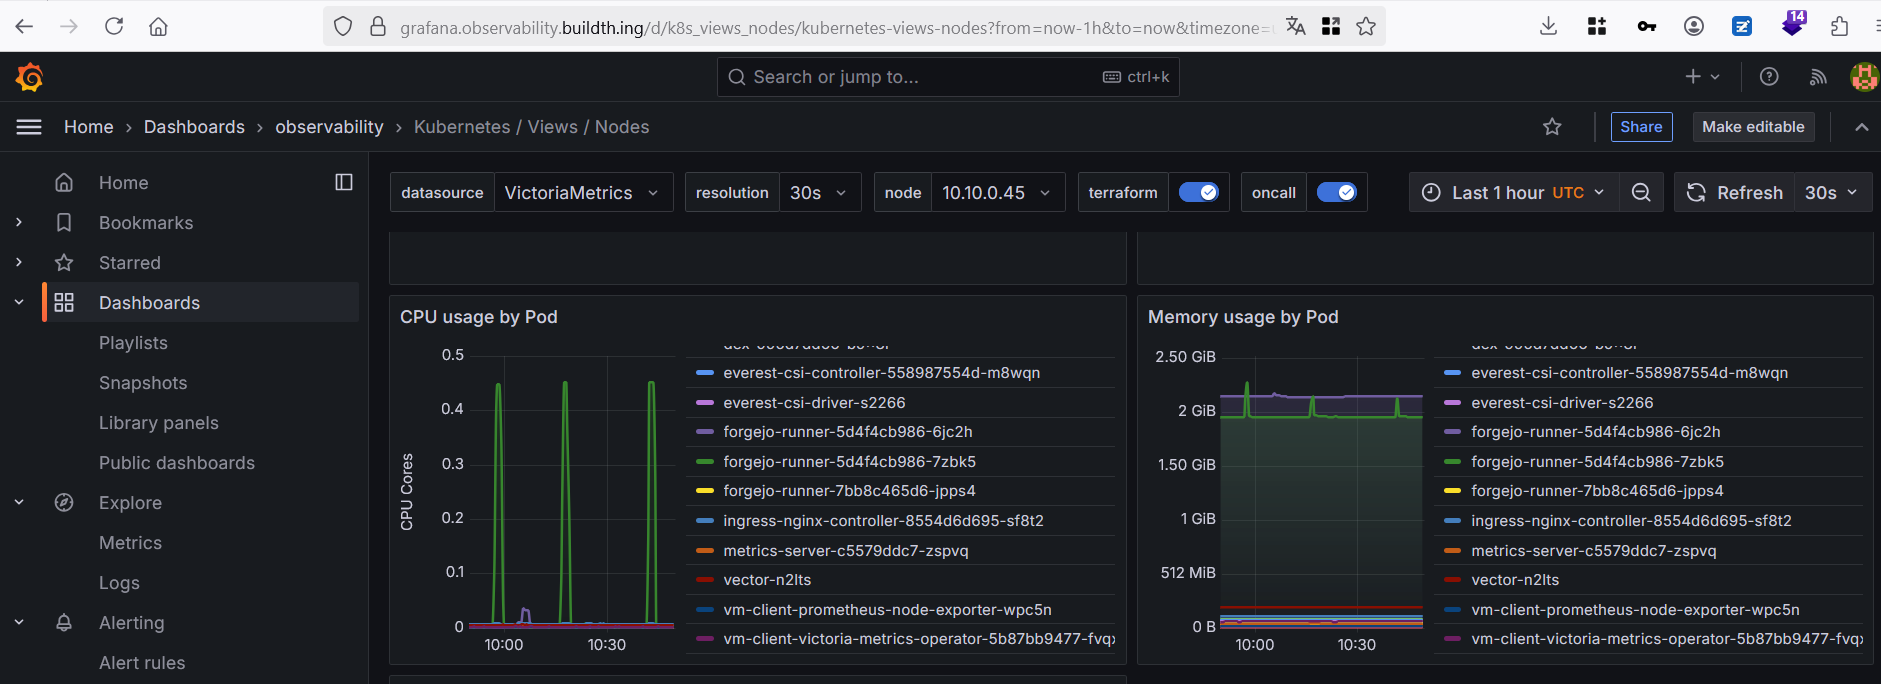
Maintenance
EDP maintenance follows an issue-driven strategy.
Updates & Upgrades
Updates are performed on-demand for individual components in
stacks.
Backup & Recovery
Customer data within EDP is regularly backed up. Refer to
IPCEICIS-5017 for details.
5 - StageX Container Images
Zero-trust reproducible container base images for the IPCEI-CIS platform.
Overview
StageX provides minimal, reproducible, zero-trust container base images for the IPCEI-CIS Edge Developer Platform. Built from source using the StageX upstream methodology, these images contain no package manager and compose dependencies exclusively via the COPY --from= OCI pattern.
Repository: edp.buildth.ing/DevFW-CICD/stagex
Stakeholder KPI Report: Confluence — KPI e1 & e2 D62/D64
Key Properties
- Zero-trust — no package manager, no shell in production images, minimal attack surface
- Reproducible — all images pinned by sha256 digest;
SOURCE_DATE_EPOCH ensures deterministic timestamps - Minimal — musl libc, LLVM/Clang toolchain; production runtime images as small as 4.86 MB
- Signed — cosign key-based signing with Kyverno N-of-M policy verification
- Scanned — dual-scanner pipeline: Trivy (app-level) + Grype CPE (OS-level NVD matching)
- Efficient — 100% layer efficiency, 0 wasted bytes; 37% smaller Forgejo Runner image achieved
Image Size Comparison
StageX images are significantly smaller than standard enterprise base images:
| Image | Size | Use Case |
|---|
| stagex-base-static | 4.86 MB | Compiled binaries (Go, Rust) — no shell, musl + ca-certs only |
| stagex-base-go | 4.86 MB | Go applications (musl + ca-certs) |
| stagex-base | 45.7 MB | Applications needing shell + OpenSSL |
| Alpine | ~7 MB | Common lightweight alternative |
| ubuntu:24.04 | 78 MB | Common enterprise default |
| debian:bookworm-slim | 130 MB | Most common enterprise CI/CD base image |
For compiled Go/Rust binaries using stagex-base-static:
- 96% smaller than debian:bookworm-slim
- 94% smaller than ubuntu:24.04
- Fewer bytes = faster pulls, less storage, less network I/O, smaller attack surface
Baseline context: debian:bookworm-slim is used as the primary comparison because it represents the most common default base image in enterprise CI/CD pipelines. The stagex-base-static image is optimized for compiled binaries that require no shell or runtime dependencies.
Available Images
All images are published to the EDP container registry:
| Image | Description | Size |
|---|
stagex-base | Minimal base (busybox + musl + OpenSSL + ca-certs) | 45.7 MB |
stagex-base-go | Go runtime (musl + ca-certs, no toolchain) | 4.86 MB |
stagex-base-static | Static binary base (musl + ca-certs, no shell) | 4.86 MB |
stagex-base-nodejs | Node.js runtime | 236 MB |
stagex-base-python | Python runtime | 381 MB |
stagex-base-rust | Rust runtime | 4.86 MB |
stagex-base-java | Java runtime (Temurin JRE 21) | 53.8 MB |
stagex-base-ruby | Ruby runtime | 115 MB |
Registry path: edp.buildth.ing/devfw-cicd/stagex-{base,base-go,base-nodejs,base-python,base-rust,base-java,base-ruby,base-static}
Vulnerability Scanning
StageX uses a dual-scanner pipeline because no single scanner covers all layers:
| Scanner | What it scans | Why needed |
|---|
| Trivy | App-level: Go binaries, Node.js deps, secrets, misconfig, license | Standard vulnerability scanner; covers application dependencies |
| Grype CPE | OS-level: NVD matching via manually curated cpes.txt | StageX is not a recognized distro for Trivy — no /etc/os-release or package database. Grype CPE fills this gap. |
The cpes.txt file lists CPE 2.3 entries for all packages included in StageX images (musl 1.2.5, busybox 1.37.0, openssl 3.4.1, etc.) and is updated when package digests are bumped.
CI gate: Trivy hard-fails on CRITICAL vulnerabilities. Grype CPE runs as advisory (upstream-controlled packages).
Build Methodology
StageX images are composed without a package manager. Dependencies are layered using the OCI COPY --from= pattern:
FROM stagex/core-busybox AS busybox
FROM stagex/core-musl AS musl
FROM stagex/core-openssl AS openssl
FROM scratch
COPY --from=musl / /
COPY --from=openssl / /
COPY --from=busybox / /
All upstream StageX packages are built from source with:
- musl libc (not glibc)
- LLVM/Clang toolchain
- PGP quorum signing for upstream package verification
- Stage0 bootstrap chain — from minimal hex assembler (
hex0, ~500 bytes) through increasingly complex compilers to full LLVM/Clang. No pre-compiled binary is trusted.
CI Pipeline
The build pipeline (.forgejo/workflows/build-sign.yaml) performs:
- Build — multi-stage Docker build with
SOURCE_DATE_EPOCH for reproducibility - Scan — Trivy (app-level) + Grype CPE (OS-level NVD matching) + Malcontent (behavioral analysis)
- SBOM — generates SPDX and CycloneDX Software Bill of Materials
- Push — publish to EDP registry with digest pinning
- Sign — cosign key-based signing with git SHA and provenance annotations
- Verify — automated signature verification post-push
Supply Chain Verification
Cosign Signing
All images are signed using cosign with key-based signatures (not keyless — Forgejo OIDC is not in Fulcio’s trust root):
cosign verify --key cosign.pub edp.buildth.ing/devfw-cicd/stagex-base:latest
Signature annotations include: git.sha, git.ref, build.workflow, source.repo.
Kyverno Admission Control
A Kyverno ClusterPolicy (policies/kyverno-require-signatures.yaml) enforces 2-of-3 multi-party signature verification at pod admission:
- CI pipeline key (automated)
- Security team key (manual review)
- Release manager key (release approval)
Unsigned or insufficiently signed images are rejected at the Kubernetes API level:
kubectl run test --image=debian:bookworm-slim --dry-run=server
# Error: admission webhook "validate.kyverno.svc" denied the request:
# Only signed StageX base images are allowed
Requirements
- Docker v25+ with containerd image store enabled (required for OCI image handling)
- amd64 architecture (arm64 designed for but pending upstream support)
Completed Work
| Story | Description | Status |
|---|
| Evaluate StageX | Assessed upstream StageX for IPCEI-CIS suitability | ✅ Complete |
| Reproducible multi-arch | Reproducible build pipeline (amd64; arm64 designed) | ✅ Complete |
| Language images | Go, Node.js, Python, Rust, Java, Ruby, Static runtimes | ✅ Complete |
| Supply-chain security | Cosign signing + Kyverno 2-of-3 verification | ✅ Complete |
| SBOM & scanning | Trivy + Grype + Malcontent; SPDX + CycloneDX generation | ✅ Complete |
| Reference tool | Forgejo Runner built on StageX (37% smaller) | ✅ Complete |
| Documentation | This page + signing guide + onboarding guide | ✅ Complete |
6 - Documentation System
This documentation system, built on the ‘documentation as code’ principle, is used internally and recommended for all development teams.
Embracing the powerful philosophy of Documentation as Code, the entire
documentation is authored and meticulously maintained as plain text Markdown
files. These files are stored within a Git repository, allowing for the
leveraging of version control to track changes, facilitate collaborative
contributions, and ensure a robust review process, much like source code.
The documentation source code is hosted at
https://edp.buildth.ing/DevFW-CICD/website-and-documentation. The README
files within this repository provide detailed instructions on how to contribute
to and build the documentation. It is primarily powered by
Hugo, a fast and flexible static site generator, which
transforms the Markdown content into a production-ready website. To enhance
clarity and understanding, sophisticated diagramming tools are integrated:
Mermaid.js for creating dynamic charts and diagrams
from text, and LikeC4 for generating C4 model
architecture diagrams directly within the documentation.
Changes pushed to the main branch of the repository automatically trigger the
continuous integration and deployment (CI/CD) pipeline. This process is
orchestrated using Forgejo Actions, which
automates the build of the static site. Subsequently, the updated documentation
is automatically deployed to https://docs.edp.buildth.ing/. This streamlined
workflow guarantees that the documentation is always current, accurately
reflecting the latest system state, and readily accessible to all stakeholders.